Select Starting Point for the Chart Help
Suppose you have a control chart with 20 data points. The process has changed and you want to start the control chart at the point where the process changed. Suppose this point 11. You can delete the data for points 1 to 10 in your worksheet and then update the control chart. However, you probably would like to keep that data as a historical record. In this case, you can use the “Select the subgroup (sample) identifier at which to start the chart” option from the Control Chart Actions form.
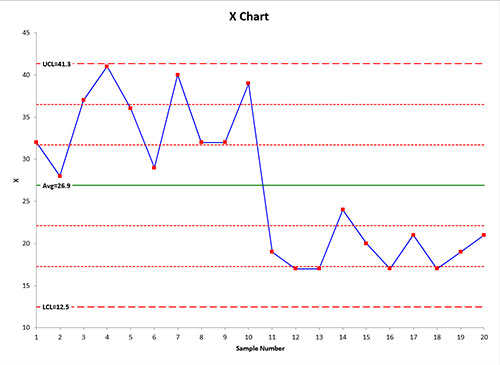
To see how this is done, we will use the dataset from the Split Control Limits page. The X control chart for that dataset is shown below.

You would like to start the control chart a point 11. You do this by following these steps:
- 1. Select the chart
- 2. Select “Actions” in the “Control Charts” panel on the SPC for Excel ribbon to display the Control Chart Actions form.
- 3. Select the “Select the subgroup (sample) identifier at which to start the chart” option in the “Multiple Points Action” section.
- 4. Select OK on the “Control Chart Actions” form.
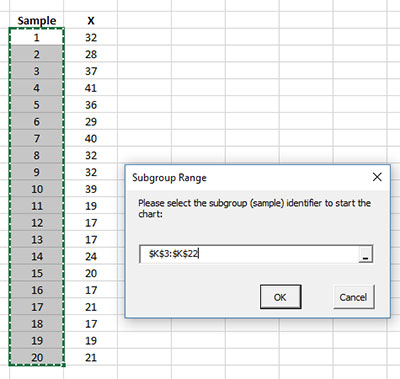
- 5. An input screen is displayed that lists all the subgroup (sample) identifiers.

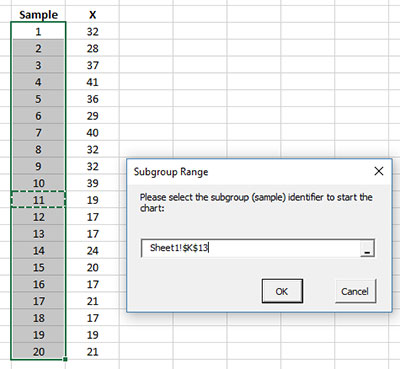
- 6. Select the point where you want the control chart to start (point 11) in this example.

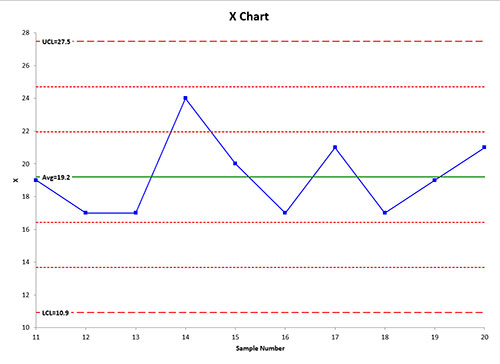
- 7. Select OK. The control chart is redrawn starting at the selected point as shown below.

Notes:
- When this option is selected, the control chart is treated as a new control. The calculations are re-done with the new starting point and the automatic updating of control limits is set to Yes.
