Control Chart Actions
Home » SPC for Excel Help » Control Charts Help » Control Chart Actions
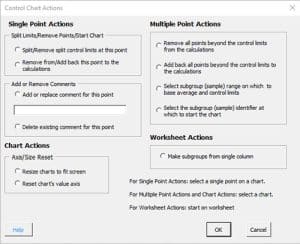
There are a number of actions that can be done when a control chart has been made including splitting control limits, adding comments, removing points from the calculations and selecting which data on which to base the control limits. These are accessed from the Control Chart Actions form.
To access the Control Chart Actions form, select “Actions” from the “Control Charts” panel on the SPC for Excel ribbon.
Selecting “Actions” displays the following screen:

Single Point Actions
- Split/Remove split control limits at this point – this option allow you to split the control limits or remove a split control limit at a single point; you may split control limits multiple times on a control chart.
- Remove from/Add back this point to the calculations – this option removes a single point from the calculations or adds it back to the calculations; the point remains plotted but the point’s marker is not filled on the chart.
- Add or replace comment – this option allows you to add or replace a comment on a point in a control chart; e.g., you might want to record the reason for an out of control point or a process shift.
- Delete existing comment – this option deletes an existing comment from a point.
Each of these options require that you select a point on the chart where you want the action to occur (split limit, delete point from calculations, etc.). Details of selecting a single point on a chart are given in the split/remove split control limits option.
Multiple Point Actions
- Remove all points beyond the control limits from the calculations – this option removes all points beyond the control limits (above the upper control limit or below the lower control limit) at one time from the calculations; the points remain plotted but the points’ markers are not filled on the chart.
- Add back all points beyond the control limits to the calculations – this option adds back all points beyond the control limits to the calculations.
- Select subgroup (sample) range on which to base average and control limits – this option allows you to select the subgroup or sample range on which to base the average and control limit calculations
- Select the subgroup (sample) identifier at which to start the chart – this option sets the first point to start the chart; all calculations start from this point.
Chart Actions
- Resize charts to fit screen – this option re-sizes the control charts on a worksheet to fit the screen; when a control chart is first made on a worksheet, it is sized to fit the active window; if you change the zoom, the control chart will no longer be sized to fit the window; this option re-sizes the control charts to fit the new window size.
- Reset chart’s value axis – this option resets the value axis for the chart; the software selects the minimum and maximum values for the Y axis; this allows you to set the Y axis values back to automatic with one click.
Worksheet Actions
- Make subgroups from a single column – this option allow you to make subgroups from a single column; it does not apply to a finished chart but to the worksheet before a chart is made.
