Miscellaneous Tools
Home » SPC for Excel Software » Miscellaneous Tools
SPC for Excel includes the following tools:
- Chi-Square Goodness of Fit: used to determine if a set of data fits a particular distribution.
- The Chi-Square Test for Association: used to determine if there is any association between two variables.
- A side by side histogram: used to compare results.
- The Item Analysis procedure: a method of testing how reliable the questions are on a survey.
- Random number generator: generates random number from fourteen distributions.
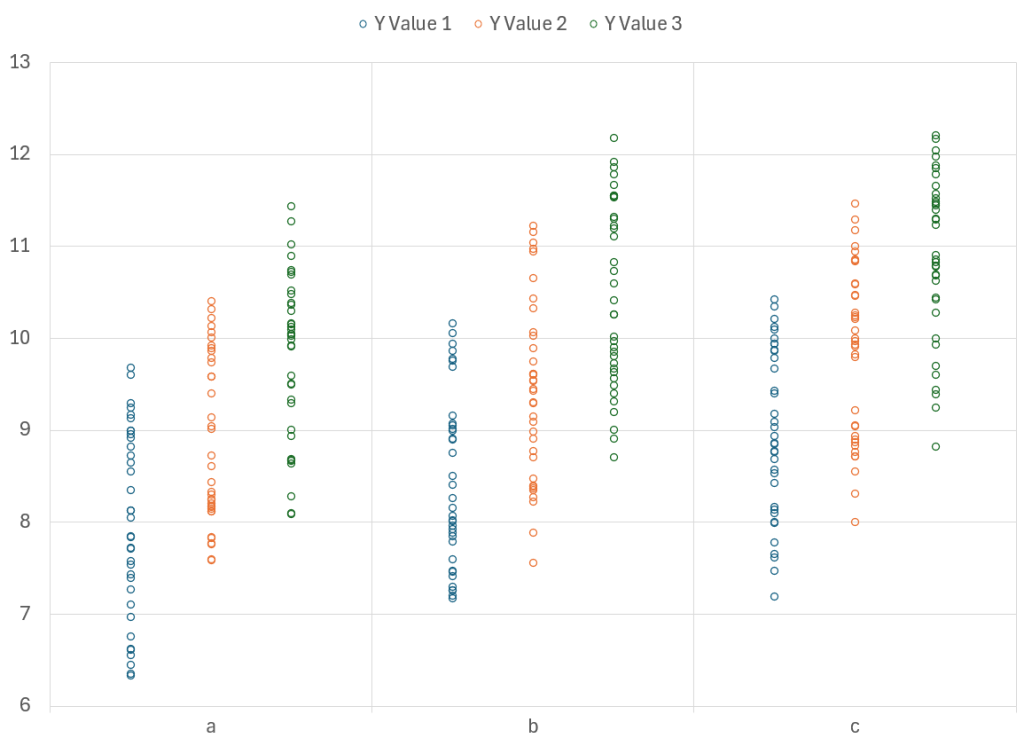
- Individuals plot: shows the how the individual values are distributed so you can compare different data sets to see if there a difference in average or amount of variation.
- Interval plot: shows the mean and the 95% confidence limits around the mean to easily see if there are differences in the mean or variation between data sets.
- Beeswarm plot: a visual way of seeing individual data points and how they are distributed.
