Box-Cox and Johnson Transformations
Home » SPC for Excel Software » Box-Cox and Johnson Transformations
Having data that are normally distributed often simplifies your life. Many statistical tests are based on the assumption that your data are normally distributed. The calculation of Cpk (process capability) values require a normal distribution. If you data are not normally distributed, the first thing to try is to transform the data into a normal distribution using either the Box-Cox transformation or the Johnson transformation.
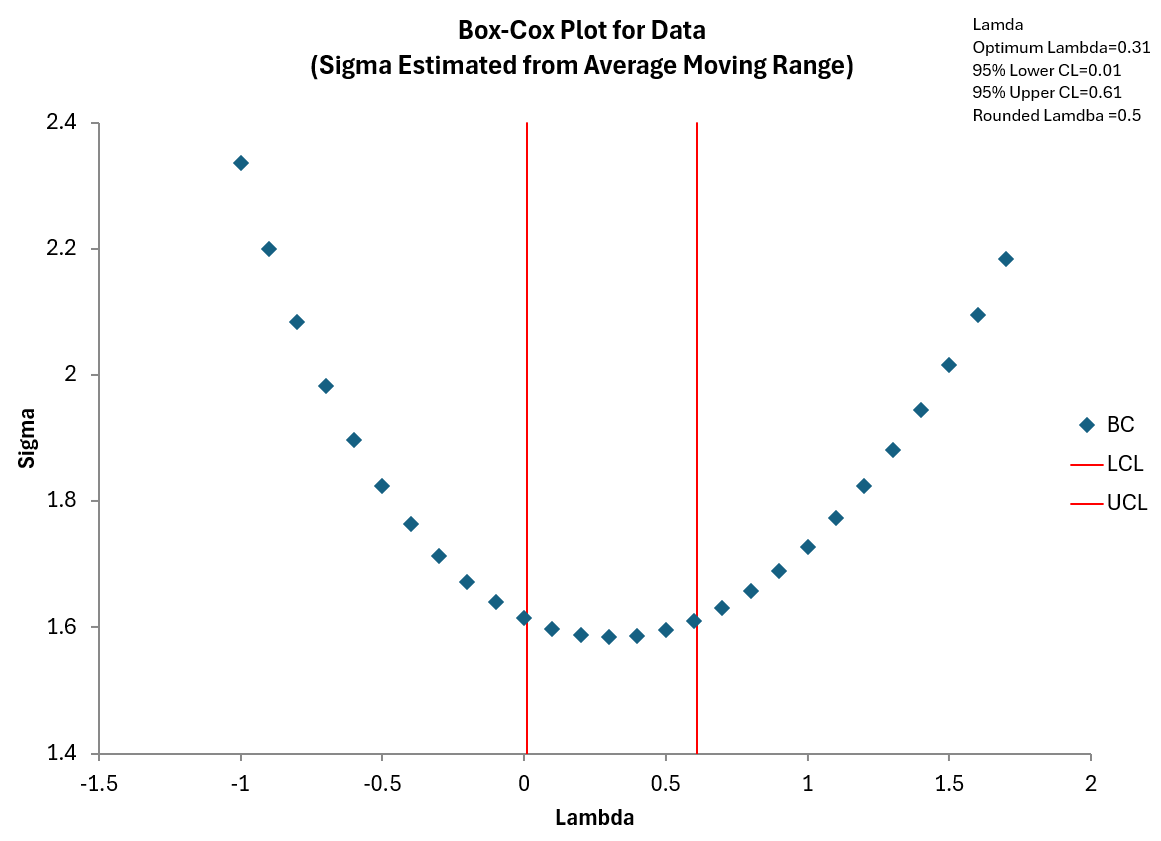
The Box-Cox transformation is Yλ where λ is value between -5 and 5. The procedure is designed to find the value of λ that minimizes the variation (standard deviation). For example, if λ = 2 minimizes the variation, then the data would be transformed as Y2. The Johnson transformation is more complex than the Box-Cox transformation. The Johnson transformation is chosen from three different functions by changing four parameters.

Watch a Video of SPC for Excel's Box-Cox Transformation
Join our users from around the world - over 80 countries - who have found SPC for Excel to be just the tool they need for their statistical analysis!
Box-Cox Transformation Features
- Individual or subgroup values
- Option to use standard deviation estimated from pooled variance, subgroup average range, or subgroup average standard deviation
- Optimum lambda or round lambda
- Descriptive statistics of the original and transformed data including Anderson-Darling statistic and associated p-value
- Histograms of original data and transformed data
- P-P plot for original data and transformed data
- Print out of transformed data values
Johnson Transformation Features
- Plot the z value versus p-value for each of the three Johnson distributions (SB, SU, SL)
- Descriptive statistics of the original and transformed data including Anderson-Darling statistic and associated p-value
- Histograms of original data and transformed data
- P-P plot for original data and transformed data
- Print out of transformed data values