Six Sigma Excel Add-In Software
Home » Six Sigma Excel Add-In Software
SPC Software for Six Sigma and Lean
Statistical Process Control (SPC) is a pillar in Lean and Six Sigma methods. SPC for Excel, a Six Sigma Add-in Software, runs in familiar environment of Excel. Quickly create all the statistical charts and perform the data analysis you need to help you solve problems, decrease defects, eliminate waste, and see progress in your improvement efforts.
Why Pay More Than You Need? Why Take Days to Learn?
- Use SPC for Excel - simple yet powerful Six Sigma Add-in Software.
- The way to go for Lean and Six Sigma professionals - Best Value!
- All the needed SPC tools, charts, analysis and training.
- Yellow to Black Belt, easy to use throughout the DMAIC methodology.
- On-line help files, example data files and how-to videos.
- One-time price with free builds, no maintenance fees.
- Install on two computers (work and home) for a single user.

Six Sigma Tools included in SPC for Excel Six Sigma Add-in Software
| Yellow Belt | Green Belt | Black Belt |
|---|---|---|
| Pareto Charts | Same as Yellow Belt + | Same as Green Belt + |
| Run Charts | Hypothesis testing | Control Charts (30 types) |
| Scatter Diagrams | Failure Mode and Effects Analysis | MSA/Gage R&R |
| Histograms | Distribution Fitting | Process Capability |
| Measurement System Analysis | Basic Control Charts | Design of Experiments |
| Root Cause Analysis/Fishbone | Descriptive Statistics | Nonparametric Methods |
| Intro to Hypothesis Testing | Data Transformation | Comparring Multiple Processes |
| Correlation Analysis Techniques | ||
| Regeression Analysis | ||
| ANOVA | ||
| Training of others – tools |
How It Works
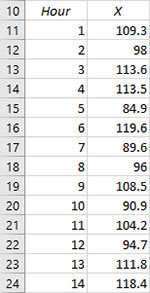
1) Enter your Data
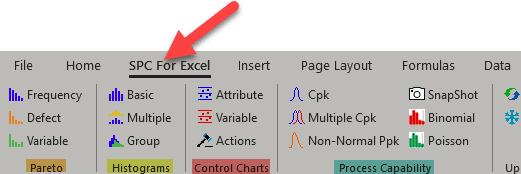
2) Select Your Option From The Familiar Excel Ribbon
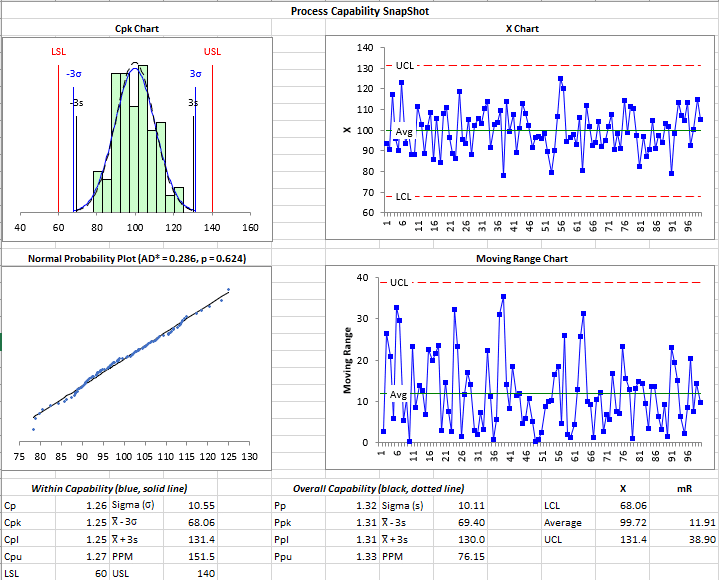
3) SPC for Excel creates the charts
Why Customers Choose Six Sigma Add-In Software

“Thank you for making SPC for Excel! It filled a need I had for a statistical tool that I was familiar with, having run six sigma projects for years”
Maureen M.
“I am a green belt taking the black belt exam, many of these tools are necessarry. Simple format, it is very convinient!”
Luvata A.
“The excel add-on is very usuful and well explained, simple to understand and to use”
Alberto S.
“I think the price is very reasonable for the capability offered. It is so much easier to use than other software packages I have looked into”
Douglass E, Ph.D.
“I’m really impressed with this software. Your instructions manual is very good as well. You’re giving Minitab a run for its money, and I’d rather use SPC for Excel”
Newton B Green