July 2024
 Sometimes I read things that I question. Can this really be true? Such is the case recently on LinkedIn where I read that Dr. Wheeler has said the following two things:
- The individuals control chart is the only control chart you need.
- You do not need to worry about any rules other than Rule 1 when interpreting a control chart.
For a variety of reasons, I found both these statements to be hard to believe. Yes, most of the time the individuals (X-mR) control chart is all you need. But the “only” one? Dr. Wheeler spends a lot of time in his writings on other charts, for example, the X-R control chart. Why did he spend all that time on other charts if the X-mR chart is all we need?
And then there are no rules other than Rule 1, which is points beyond the control limits. He has written extensively about the Average Run Length (ARL) to detect a process shift for all the rules as well as combinations of the rules. Why did he do that if all we need is Rule #1?
So, I decided to ask Dr. Wheeler about these two statements attributed to him. I emailed him and asked. I discovered that these statements need to be taken with a grain of sale and are not totally correct. Below are the emails I sent him and his responses. In this publication:
- Introduction
- Is Rule #1 The Only Out of Control Test You Need?
- Is the Individuals Control Chart the Only Control Chart You Need?
- Summary
- Quick Links
Please feel free to leave a comment below. You can download a pdf copy of this publication at this link.
Introduction
Pure and simple, Dr. Donald Wheeler is the best when it comes to statistical process control (SPC) and practical application of statistics. I know of no one better. I first met Dr. Wheeler when I attended Dr. Deming’s four-day seminar in San Diego in the early 1980s. Dr. Wheeler was one of Dr. Deming’s masters for that seminar.
Since then, I have heard him speak multiple times and I have purchased many of his books – and actually read them as well as many of the articles he has written for Quality Digest (www.qualitydigest.com) and for his own website (www.spcpress.com).
I have written monthly articles on SPC and statistical analysis on my website (www.spcforexcel.com) since January 2004. Over 220 articles, many of them influenced by Dr. Wheeler’s work, particularly his Evaluating the Measurement Process. You can access those article here: SPC Knowledge Base.
There are many articles on different types of control charts and the various rules for interpreting a control chart. We start with the question about Rule #1.
Is Rule #1 The Only Out of Control Test You Need?
There are quite a few out of control tests, in fact too many. If you apply them all, you will probably have lots of out of control situations. Rule #1 is that a special cause is present if you have a point beyond the control limits. Rules 2 to 4 are also collectively called the zones test. They are based on dividing the control chart into 3 equal zones above the average and three equal zones below the average as shown in Figure 1.
Figure 1: Control Chart Divided into Zones
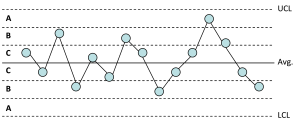
The zone tests are given by:
- Rule #2 (or Zone A test): a special cause exists if 2 out 3 consecutive points are in Zone A or beyond
- Rule #3 (or Zone B test): a special cause exists if 4 out of 5 consecutive points are in Zone B or beyond.
- Rule #4 (or Zone C test): a special cause of variation exists if 8 or more consecutive points are in Zone C or beyond (a run of 8 or more above or below the average).
These are the four major rules for detecting special causes of variation. There are others including number of runs test, test for stratification, test for mixtures, test for overcontrolling, and trends up or down tests. You can get more details on these tests with our SPC Knowledge Base article: Control Chart Rules and Interpretation.
So, is Rule #1 the only test you need? Here is the email I sent to Dr. Wheeler about rule #1.
Hello Dr. Wheeler,
I hope you and yours are doing well. I have a question about control chart interpretation. I have seen several people say that you believe that you only need the points beyond the control rule for statistical control, none of the other rules, like the zone tests.
In your last Quality Digest article, on the Rameriz-Runger test, you showed a control chart whose average was meandering around – up then down. While not actually applying any of the zone tests, you can tell by looking that it would fail the tests. Perhaps a reason not to worry about them. You can usually tell if a process is out of control without any actual tests.
But if you only worry about the point beyond the control limits, when does it become enough to worry about a run below the average? 8 points? 10 points, 20 points? I think some people just like to get that signal it is time to look for something.
You also have done a lot of work on comparing how effective the zone tests are, for example, your paper When Should We Use Extra Detection Rules? And you found some of them or combination of them were acceptable.
Then I think about the sawtooth patterns for overcontrol and hugging the center line for multiple processes. Again, easy to see if you look at the control chart and understand that those are special causes.
And then you use the zones tests as part of the classification in EMP.
I haven’t seen where you say only use Rule #1, so I thought I would ask directly.
Thank you for your time.
Bill McNeese
And here is Dr. Wheeler’s response (with his permission to share):
Bill,
You have to be careful about hearsay evidence. So thanks for asking.
In practice, Rule 1 is often all we need because there are so many signals.
I do recommend turning off the other detection rules in your software, but I also tell my classes to keep those run test rules in their hip pockets, and to pull them out when something looks suspicious. When one of the run tests is satisfied and the run tells a story in the context of the data, you have a license to go looking for an assignable cause.
Before software, most practitioners found rules 1 and 4 to be sufficient.
For detecting signals greater than 2.5 std. errors rule 1 gives 80% detection within 10 subgroups, and a 50% chance of detecting a shift of 1.5 to 2.5 std. errors.
With either rules 1 and 2 or rules 1 and 4 the chance of detecting a 2.5 std. error shift within 10 subgroups goes up to 100%, while the chance for a shift of 1.5 to 2.5 std. errors goes up to 80%.
Adding more detection rules simply increases the chances of detecting the shifts smaller than 2.5 std. errors.
And we are interested in the larger shifts first.
However, if we mess up our subgrouping, and subgroup unlike things together, then the run tests may be what gets us out of the trouble caused by the bad subgrouping. That is why we keep them handy.
Hope this helps, Once again, thanks for asking.
Best wishes.
Don
I do have only Rule #1 set as default in my software (SPC for Excel, www.spcforexcel.com), but the other tests are there if needed. It is true that first starting out, you probably will have more than enough out of control points to worry about using just Rule #1. Plus, it gives you time to help people get used to using control charts.
Getting a process into statistical control takes work. You have to identify the special causes and then eliminate them. But over time, you should reduce the out of control situations due to Rule 1. It makes sense to add the other rules (zone tests) at that time or some combination of them as suggested by Dr. Wheeler above. So, don’t forget about the other rules.
Is The Individuals Control Chart the Only Control Chart You Need?
There are many types of control charts. So is the X-mR control chart all you need? Below is the email I sent Dr. Wheeler to ask if this is true.
Hello Dr. Wheeler,
One more question on possible hearsay. I continue to hear on LinkedIn that you have said the only control chart you need is the individuals control chart. I understand that the individuals chart will suffice in any situation (subject to rare events and chunky data). Definitely use the individuals chart in place of the attributes charts where the conditions don’t hold.
But only using the individuals seems to do away with rational subgrouping and the Xbar-R or Xbar-s chart. People simply take the data as collected with no thought of rational subgrouping – which does apply to individuals charts as well as the subgroup charts. It appears to me that you can lose a lot by not considering rational subgrouping and how you can subgroup the data to explore the variation of interest to you. Of course, limited data automatically leads to the individuals control chart.
Thank you for your time.
Best Regards,
Bill
And here is Dr. Wheeler’s response.
Bill,
Thanks for asking.
I definitely use and recommend average and range charts as appropriate.
Subgroup sizes greater than 15 will seldom be rational, so Average and std. dev. charts are rarely needed, but can be used when needed.
Rational subgrouping is an art, and when unsure about your subgrouping, it is good to start with an XmR chart. Of course, here we can screw up an XmR chart by combining apples and oranges in sequence, so the principles of rational subgrouping and rational sampling still apply.
While I am the major promoter of the XmR chart, I do use other tools as well.
Hope this helps.
Don
It would appear that Dr. Wheeler does not fully agree the individuals chart is the only control chart you need. Yes, it works in most places – and is the go to chart if you don’t what to use. But it is not the only one. And he emphasizes that rational subgrouping and rational sampling is required even with individuals control charts to be sure you are not comparing apples and oranges. His recent article on Quality Digest’s website, The History of the Chart for Individuals Values, discusses this in more detail.
For more information on the individuals control chart, you can visit our SPC Knowledge Base articles. Two that you might be interested in are:
- Comparing X-mR and Xbar-R Control Charts
- Ten Things to Know When Using the Individuals Control Charts
Summary
This publication examined two comments that were attributed to Dr. Wheeler by some. One was that Rule #1 is all you need in interpreting control charts. This is not quite true. As shown above, Dr. Wheeler says you normally start out with just Rule #1 because you have a lot of special causes at first. But you need to keep Rules 2 to 4 handy in case you see something odd on the control chart.
The second was that the individuals control chart is all that you need. While it works in many places, Dr. Wheeler does say that he uses and recommends averages and ranges charts when appropriate.
The two statements, attributed to Dr. Wheeler, are not quite correct.