December 2024
The two sample Poisson rate test is one of the new techniques in the just release SPC for Excel version 7. To view what is new in version 7, please select this link. To see all the statistical tools in SPC for Excel, please select this link.

To use the two sample Poisson rate test, the two processes must follow the Poisson distribution. This mainly means that the frequency of events is rare, and the number of events can be counted.
This publication shows how the two sample Poisson rate test can be used to answer the following question:
Are the population rates of events in the two groups the same or different?
The population represents all outcomes in the process. We can’t measure everything, so we take samples to estimate the population parameters. We will do this with the two sample Poisson rate test.
In this issue:
- Overview
- Example Data
- Calculations and Conclusions
- Options for the Two Sample Poisson Rate Test
- Summary
- Quick Links
Feel free to leave a comment at the end of the publication. You can also download a pdf copy of this publication at this link.
Overview
Some processes can be modeled by a Poisson distribution. Wikipedia defines the Poisson distribution as the following:
In probability theory and statistics, the Poisson is a discrete probability distribution that expresses the probability of a given number of events occurring in a fixed interval of time if these events occur with a known constant mean rate and independently of the time since the last event. It can also be used for the number of events in other types of intervals than time, and in dimension greater than 1 (e.g., number of events in a given area or volume).
Kind of confusing. Basically event data follows a Poisson distribution if the following are true:
- The events must be discrete events.
- The events must occur in a well-defined region of space or time.
- The events are independent of each other, and the likelihood of an event is proportional to the size of the area of opportunity.
- The events are rare compared to the opportunity.
You might notice the above list as the requirements for using a c control chart. The c control chart is based on the Poisson distribution.
This publication shows how to compare two groups, both of which follow a Poisson distribution, to determine if the population rates of the two groups are the same or different. This is done by taking independent samples from each group. The samples are used to calculate the samples rates for each group.
A confidence interval for the difference in the population rates is calculated. If the confidence interval contains zero, then we conclude that the difference in the population rates can be zero – the two groups have the same population rate. If the confidence interval does not include zero, we conclude that the two population rates are not the same.
The hypotheses for the two sample Poisson rate are:
H0: l1 – l2 = 0
H1: l1 – l2 ≠ 0
where H0 and H1 are the null hypothesis and the alternate hypothesis, respectively, and l1 and l2 are the population rates for group 1 and group 2.
We will show how to perform the two sample Poisson rate test using an example. The analysis was done using the SPC for Excel software.
Example Data
Suppose you own two restaurants. You would like to know if the number of customers per day is the same at the two restaurants: 1 and 2. You collect data for 30 days. The data are shown in Table 1.
Table 1: Two Sampe Poisson Rate Data
|
Rest. 1 |
Rest. 2 |
Rest. 1 |
Rest. 2 |
|
|
235 |
231 |
216 |
197 |
|
|
225 |
182 |
193 |
153 |
|
|
208 |
205 |
214 |
193 |
|
|
145 |
193 |
197 |
191 |
|
|
224 |
169 |
202 |
143 |
|
|
210 |
227 |
151 |
206 |
|
|
235 |
236 |
221 |
136 |
|
|
170 |
177 |
217 |
212 |
|
|
220 |
225 |
208 |
220 |
|
|
219 |
246 |
252 |
178 |
|
|
202 |
168 |
236 |
221 |
|
|
185 |
185 |
191 |
144 |
|
|
220 |
220 |
220 |
238 |
|
|
181 |
151 |
184 |
174 |
|
|
198 |
221 |
192 |
169 |
We will use this data to demonstrate how the two sample Poisson rate test works.
Calculations and Conclusions
The calculations start by determining the sample rates for both restaurants using the following equation:
Sample Rate = Total Number of Events/Sample Size
where the total number of events is the total number of customers, and the sample size is the number of days that data was collected (30). The total number of customers for restaurant A is 6,171 while the total number of customers for restaurant B is 5,811. The sample rates for the two restaurants are given as follows:
Sample Rate for Restaurant 1 = 6171/30 = 205.7
Sample Rate for Restaurant 2 = 5811/30 = 193.7
Are these two sample rates the same? This is the question we want to answer with the two sample Poisson rate test. Of course, the two rates are different – one is 205.7 and one is 193.7. Variation makes sure that they are different. But are they significantly different?
The sample rate difference is the difference between the sample rate for restaurant 1 and the sample rate for restaurant 2:
Sample Rate Difference = 205.7 – 193.7 = 12
If the two sample rates are the same, you would expect the difference to be 0. Of course, it is not due to variation. The question to be answered:
Is the sample rate difference significantly different than 0?
How do we do this? There are two ways we can do this. One involves constructing a confidence interval. The other involves calculating a p-value. We will start with the confidence interval.
To construct a confidence interval, we calculate an upper confidence limit (UCL) and a lower confidence interval (LCL) to define the boundaries of the confidence interval. These boundaries represent the range of possible differences in population rates. If the confidence interval contains zero, we conclude that the difference in population rates can be zero, and the two groups can have the same population rate. If the confidence interval does not contain zero, we conclude that the difference in population rates cannot be zero and the two groups have different population rates.
The confidence interval for the difference in sample rates is given by the following:
where alpha (a) is the significance level, za/2 is the upper a/2 percentile point of the standard normal distribution, n1 and n2 are the sample sizes for the two groups, and g is the true value of the difference in population rates.
Typical values of alpha are 0.05 and 0.10. The significance level gives the risk of accepting the null hypothesis when you should not. A value of 0.05 means that risk is 5%. This is also related to the confidence interval. If alpha = 0.05, the confidence interval is a 95% confidence interval. For this example, we will use a value of 0.05 for alpha.
To calculate za/2, you can use the Excel function NORM.S.INV(a/2). Using alpha = 0.05, za/2 is then 1.96. The confidence interval can then be calculated:
4.849 ≤ g ≤ 19.95
Since the confidence interval does not contain zero, we conclude that the two restaurants do not have the same population rate. There is a statistically significant difference between the two.
In addition to the confidence interval, you can calculate a p-value to determine if there is a statistically significant difference between the two rates. To use this approach, you calculate a z value (assuming a normal distribution) and calculate the p-value. The p-value is the probability of getting that z value if the null hypothesis is true. If the p-value is large, you assume it is quite possible to get that z value, and the null hypothesis is true. If the p-value is small, you assume it is not possible to get that z value, and you accept the alternate hypothesis.
The z value is calculated as the following:
The question now is what is the probability of getting that z value if the null hypothesis is true. The z value is approximately distributed as a standard normal distribution. So, we can use the Excel function NORM.S.DIST to calculate the p-value.
p-value = NORM.S.DIST(ABS(z)), TRUE) = 0.001
The p-value is compared to alpha, the significance level. Usually, if the p-value is less than alpha, then it is considered small, and the null hypothesis is rejected. That is the case in our example. So, we conclude that the two rates of customers are not the same at the two restaurants. If the p-value is greater than alpha, then we would conclude that the two rates are the same.
We conclude that the two restaurants have different population rates.
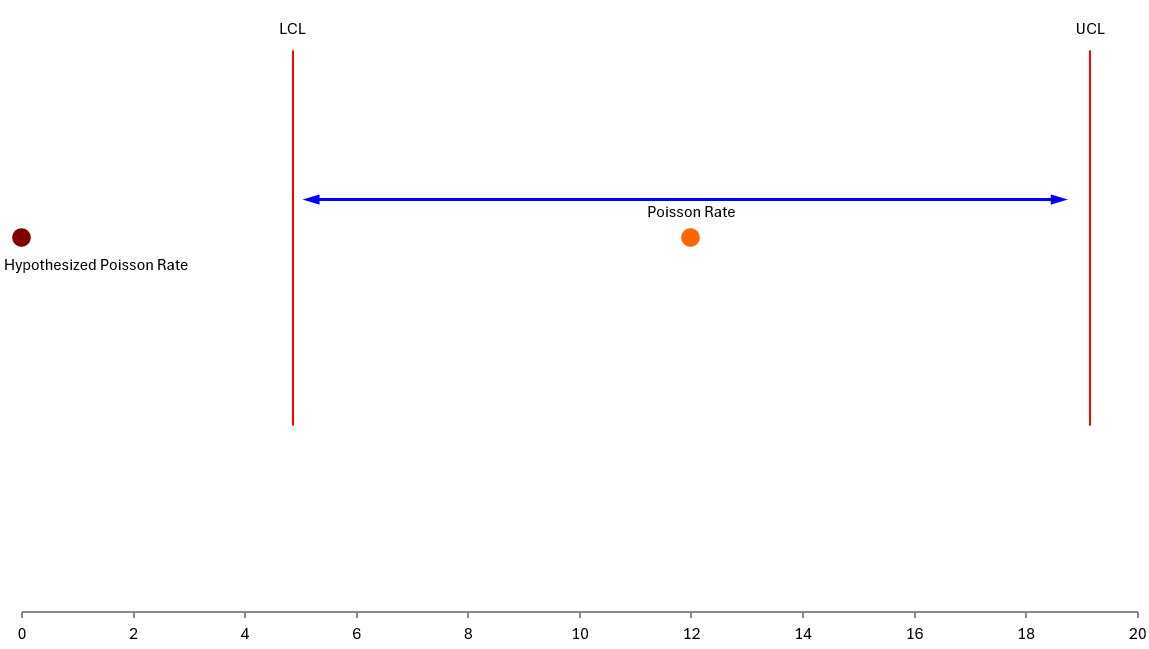
The SPC for Excel software, in addition to providing the above calculations, also provides a visual picture of the results.
Figure 1: Two Sample Poisson Rate Example
This figure shows the confidence interval, the hypothesized Poisson rate, and the calculated Poisson rate (difference in the two rates). It is easy to see that the hypothesized Poisson rate is outside the confidence interval. The two rates are statistically different.
Options for the Two Sample Poisson Rate Test
There are various options you can use with the two sample Poisson rate test. These are given below and are included in the SPC for Excel software.
The example given above is the two-sided test for the difference in population rates that follow a Poisson distribution. It is testing the null hypothesis that the difference in two population rates is equal to some value, l0.
H0: l1 – l2 = l0
In our example, l0 is 0. The null hypothesis is the same, whether it is a two-sided or a one-sided test. The difference comes in the alternate hypotheses, as shown below.
Two-sided alternate hypothesis: H1: l1 – l2 ≠ l0
Upper One-sided alternative hypothesis: H1: l1 – l2 > l0
Lower One-sided alternative hypothesis: H1: l1 – l2 < l0
This example also calculated the sample rates individually. You can also use the pooled estimate of the rates. This is sometimes recommended when the null hypothesis is that the two rates are equal, as in this example. Using the pooled estimate does not change the results in this analysis. The pooled sample rate (lpool)is given by the following:
With the pooled sample rate, the z value is calculated as the following:
There is also an exact method that can be used for hypothesis testing when testing for equal rates. It calculates the exact p-value assuming that the events follow a binomial distribution under certain conditions.
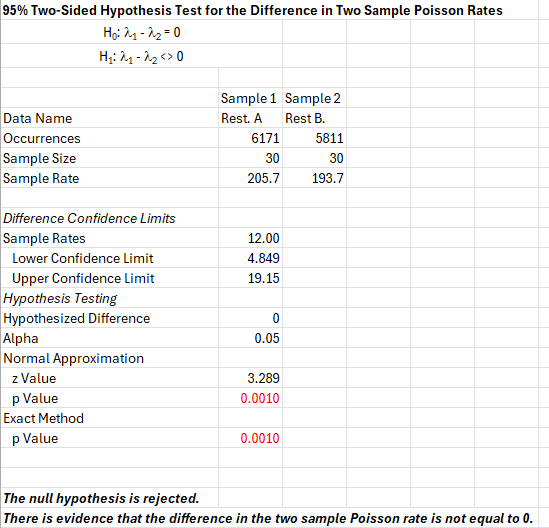
The output from the SPC for Excel program for this example is shown below.
The output contains all the results from the calculations above. It also includes the conclusion.
Summary
This publication has introduced the two sample Poisson rate test. It is used to determine if two processes have the same population rates or not. This is determined by collecting data and determining the sample rates. A confidence interval can be constructed from the data to determine a range containing the difference in the population rates. A z value can also be calculated to compare to the significance level. Either one of these will help you determine if the population rates are the same.


