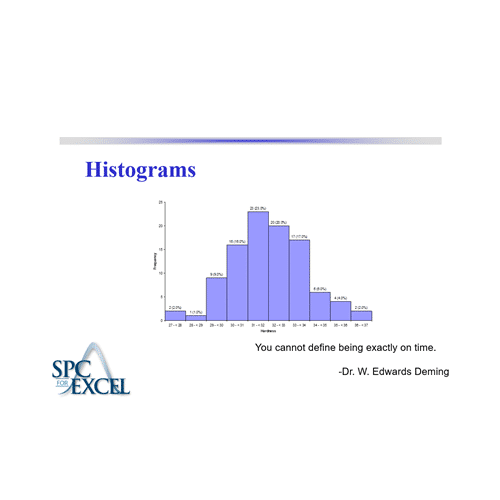
A histogram is a picture of the history of your process. It helps answer the following questions:
Which result (or range of results) occurs most frequently?
How much variation is there about that result?
What does the shape of the variation about that result look like?
Are any results out of specifications?
A process is designed to produce a product or service. But in addition, the process produces data. You can use the data to improve the process. All processes have variation. Processes that are in statistical control (only common cause of variation present) tend to generate results that form a stable pattern. This pattern is called a distribution. Distributions are characterized by three parameters: location (average or typical value), spread (amount of variation) and shape (the pattern of variation – bell-shaped, symmetrical, etc.). These parameters of a distribution can be estimated by using a histogram.
The purpose of this module is to introduce the histogram. Control charts present a picture of how a process varies over time. Histograms, on the other hand, present a picture of how the process “stacks up” over time.