Power and Sample Size Help
Home » SPC for Excel Help » Statistical Tools » Sample Tests Help » Power and Sample Size Help
- 1. Select “Sample Tests” from the “Statistical Tools” panel in the SPC for Excel ribbon
- 2. Select the “Power and Sample Size” option from the “Sample Tests” form. Select OK and the input form below is shown.

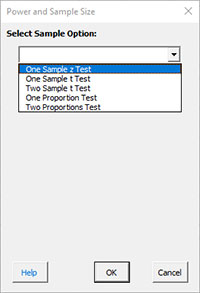
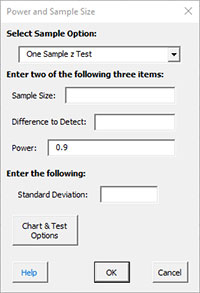
- 3. Select the sample option you want. In this example, we are using One Sample z Test. When you select the sample, the form is updated for the option for that sample.

Enter two of the following three items:
- Sample Size
- Difference to Detect
- Power (default is 0.9)
You many enter multiple values. For example, you could enter 5, 10, 15, 20 for sample sizes. Separate the multiple entries by a comma.
You must enter a value for the standard deviation.
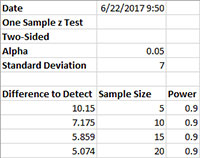
- 4. After entering the values, select OK. For example, suppose you entered differences to detect of 5, 8, 10 with a standard deviation of 7. The results on summarized on a worksheet called “Power SPC for Excel.” This output is shown below. The sample sizes required for power = .9 were calculated. The actual power is also given.

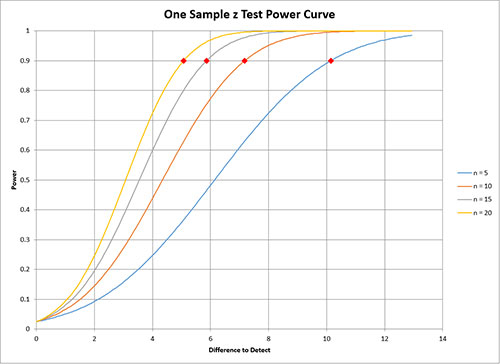
If the option to generate the power chart was true, the power chart is generated. An example is shown below.

- 5. The “Chart & Test Options” options are shown below. You may change the defaults if needed.

- Alpha: confidence level; default = 0.05
- Type of Test:
- Two sided (default)
- One sided
- Plot Power Chart: default is true
