One Sample Equivalence Test Help
Home » SPC for Excel Help » Statistical Tools » Sample Tests Help » One Sample Equivalence Test Help
This test is used to determine if there is a practical difference between an average and a target value. The user must determine a range of values that are considered to be insignificant when compared to the target value. You use your knowledge of the process to determine this range of values, which is also is called the equivalence interval. This test can be two-sided or one-sided.
The example below demonstrates how to do this test. You can download the data at this link.
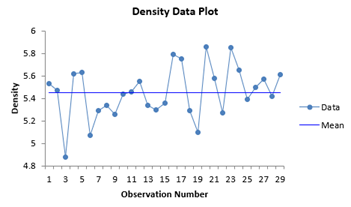
A chemist is evaluating the density of a potential new product. The existing product as a density of 5.5 and the chemist wants the density of the new product to be the same. The target value for the new product is 5.5. The chemist is willing to have the new product’s density vary from +/- 0.3 of the target value. The equivalence interval is then -0.3 to 0.3. The chemist takes 29 random samples of the new product and measures the density of each sample. The steps to perform the analysis with the SPC for Excel software are given below.
1. Enter the data into a worksheet as shown below. The data must be in one column.

2. Select the data above (including the heading).
3. Select “Equivalency Tests” from the “Statistical Tools” panel in the SPC for Excel ribbon.
4. Select the “One Sample Equivalency Test.” The input form below is shown.
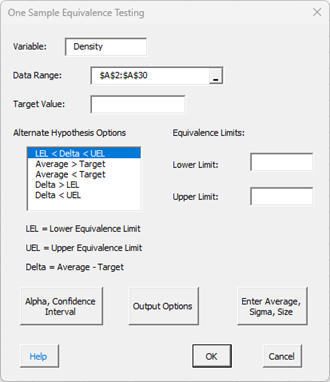
- Variable: Name of variable, default is first cell in range selected if it is non-numeric.
- Data Range: This is the worksheet range containing the data and heading; the default is the selected worksheet range, less the first cell if it is non-numeric.
- Target Value: This is the target you are going to compare to the average of the data; the target value in this example is 5.5.
- Select the Alternate Hypothesis (H1) Option; the first option is the default and is a two-sided test; the other four are one-sided test:
- Lower Equivalence Limit < Average – Target < Upper Equivalence Limit
- Average > Target
- Average < Target
- Average – Target > Lower Equivalence Limit
- Average – Target < Upper Equivalence Limit
- Lower Limit: Enter the LEL; this is a negative number representing how far below the target value you feel still represents an insignificant change; the LEL is -0.3 in this example.
- Upper Limit: Enter the UEL; this is a positive number representing how far above the target value you feel still represents an insignificant change; the UEL is 0.3 in this example.
- Alpha, Confidence Interval: The input form below is shown if this option is selected.
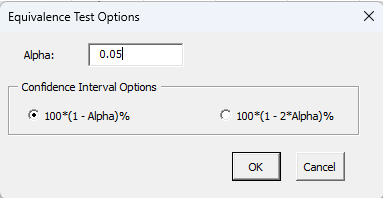
- Alpha: This is the confidence level; 1-alpha is the confidence interval; default is 0.05 or 95% confidence interval.
- Confidence Interval Options: Select the option you want to calculate the confidence interval; this option is only available if the Lower Equivalence Limit < Average – Target < Upper Equivalence Limit option is selected for H1.
- Select OK or Cancel to return to the first input form above.
- Output Options: the input form below is displayed if this option is selected.
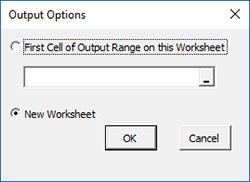
- First Cell of Output Range on this Worksheet: Select this option if you want the output on an existing worksheet; then select the first cell of the range where you want the output placed; a check is made to ensure that no existing data are overwritten in the worksheet.
- New Worksheet: Select this option if you want the results on a new worksheet.
- Enter Average, Sigma and Size: the input form below is displayed if this option is selected.
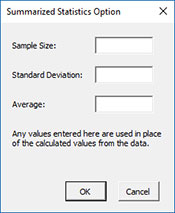
- You may enter the sample size, standard deviation, or the average; any value that is entered will be used in place of the values calculated from the data.
- Select OK or Cancel to return to first input form above.
- Select OK to generate the results.
- Select Cancel to end the program.
One Sample Equivalence Test Output
The output from the example data is shown below. A new worksheet is added to the workbook. The target value is 5.5, the LEL = -0.3 and UEL = 0.3 in this example. The alternate hypothesis chosen was Lower Equivalence Limit < Average – Target < Upper Equivalence Limit.
An explanation of terms is given below the output. In addition to the output table, the program displays two charts to help interpret the results.
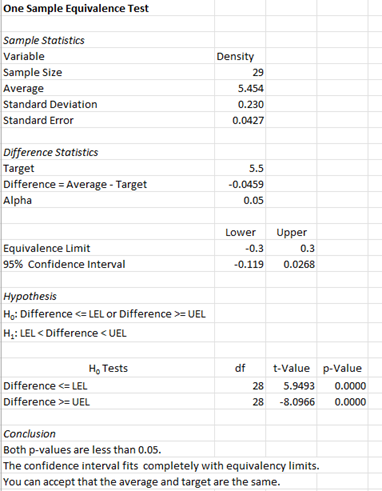
The output tells you the conclusion from the test.
- Variable: Name of variable
- Sample Size: Number of data points
- Average: Calculated average of data
- Standard Deviation (s): Calculated standard deviation
- Standard Error of Mean: Calculated as standard deviation/sqrt(sample size)
- Target: Value Entered by User
- Difference = Average- Target, difference between the calculated average and the target
- Alpha: Value of alpha entered by user (default is 0.05)
- Equivalence Limits: Lower and Upper entered by user
- 95% Confidence Interval: Calculated Lower and Upper values
- Hypothesis: H1 is selected by user, H0 is based on H1
- Conclusion: o Gives the conclusion of whether the target and average are the same based on the p-value and the confidence interval and equivalency limits; they are the same if both p-values are less than alpha and the confidence interval fits within the equivalence limits. In this example, the two conditions are true so the target and average are assumed to be the same.
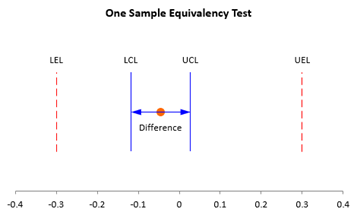
The chart below is also created. This makes it easy to see if the confidence interval for the difference is within the equivalence interval.
There is also a chart of the data to look for possible outliers. If the program detects possible outliers, they will be in red and a message will be printed on the worksheet.
