Extreme Studentized Deviate (ESD) Test Help
Home » SPC for Excel Help » Statistical Tools » Sample Tests Help » Extreme Studentized Deviate (ESD) Test Help
The Extreme Studentized Deviate (ESD) test is designed to find multiple outliers. It is based on an extension of the Grubbs’ test. The dataset must be normally distribution – not including the possible outliers.
The example below shows how to use Extreme Studentized Deviate (ESD) Test in SPC for Excel.
You may download the data at this link.

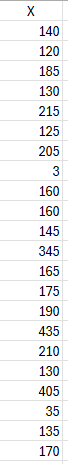
- Enter the data into a spreadsheet as shown below. The data must be in a single column with the variable name in the first cell of the column.
2. Select the data on the spreadsheet including the headings. You can use “Select Cells” in the “Utilities” panel of the SPC for Excel ribbon to quickly select the cells.
3. Select “Sample Tests” from the “Statistical Tools” panel on the SPC for Excel ribbon.
4. Select “Outliers” and then select the ESD Test
5. The ESD test input screen is shown below. The range you selected above is the default range shown in the input screen.
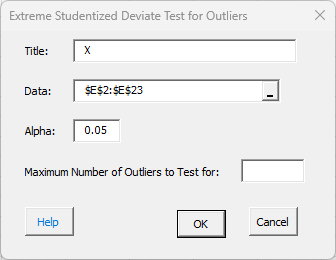
- Title: the title or name of the variable; default is the first value in the range selected if it is non-numeric.
- Data: the range containing the data; the default is based on what is selected in the spreadsheet.
- Alpha: this is the significance level for rejecting the null hypothesis when it is true; default is 0.05.
- Maximum Number of Outliers to Test for: enter the maximum number of outliers to test for; you examine the data to see how many possible outliers there could be.
- Select OK to generate the results.
- Select Cancel to end the program.
Extreme Studentized Deviate Test Output
The output from the ESD Test is shown below. A new worksheet is added to the workbook to contain the results. The first part of the output summarizes the sample results.
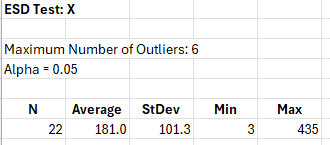
The output gives the maximum number of outliers and the significance level that was input. N is the number of data points in the sample. The sample average, the standard deviation, the minimum and the maximum are shown.
The results of the trials are then given. The number of trials is the maximum number of outliers. The output table gives the trial number, the sample result, the calculated value of G from the Grubbs’ test, the critical value of G and whether it is an outlier are not. G is the test statistic.
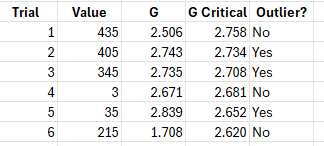
This is the two-sided Grubbs’ test. You first find out if the minimum or the maximum is farther away from the average. In this example, the maximum is 435 and it is further away from the average (181) then the minimum (3) is. So the first test is whether the maximum 435 is an outlier. It turns out it is not an outlier based on the value of G and G critical. If G is greater than G critical, the result is considered an outlier. The next test is for 405. It is an outlier based on the results. This means that 405 is an outlier (and so is 435 now). This continues until all the outliers are tested. In this example, 3, 35, 345, 405 and 435 are outliers.
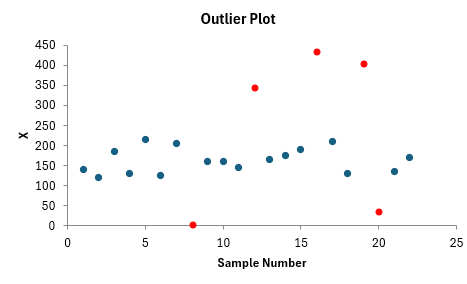
The data is also printed out on the worksheet and the outlier, if present, is turned red. A outlier plot is also provided with the outliers in red, if there are any present.