Kruskal-Wallis Test for Multiple Samples Help
The Kruskal-Wallis test determines if there is a difference between the medians of different samples. The median is used in this test since it is a better measure of the central tendency of the data than the average for non-normal data. In addition, pairwise comparisons are given to determine which medians are significantly different. The example below shows how to do this test using the SPC for Excel software.

Example (from Statistics and Data Analysis, by Ajit Tamhane and Dorothy Dunlop, Prentice-Hall, 2000)
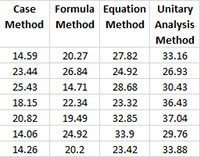
An experiment was done to compare four different methods of teaching the concept of percentages to sixth graders. 28 classes were randomly assigned to the four methods. A 45 item test was given to all classes. The average test scores are given below. We want to use the Kruskal-Wallis test to determine if there are significant differences in the four methods.
- 1. Enter the results into an Excel worksheet as shown below. The data can be downloaded at this link.
- 2. Select the data and the headings.
- 3. Select “NonParametric” from the “Statistical Tools” panel on the SPC for Excel ribbon.
- 4. Select the “Kruskal-Wallis Test for Multiple Samples” option and then OK.
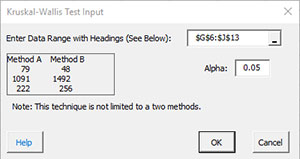
- Enter Data Range with Headings: the default entry is the range selected on the worksheet.
- Alpha: this is the confidence level; 1-alpha is the confidence interval. Default is 0.05 for 95% confidence.
- Select OK to generate the results.
- Select Cancel to end the program.
Kruskal-Wallis Test for Multiple Samples Output
The output from the Kruskal-Wallis test is shown below.
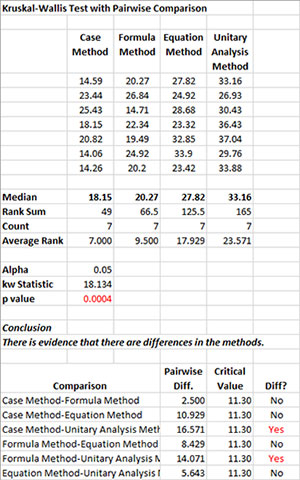
The data are reprinted at the top of the output.
- Median: Calculated median for each method.
- Rank Sum: Calculated sum of the ranks.
- Count: Number of results in each method.
- Average Rank: Calculated average rank.
- Alpha: Alpha entered by the user.
- kw Statistic: Calculated Kruskal-Wallis statistics.
- p value: Calculated p value (will be red if ? alpha).
If p value ? alpha, then there are differences between the pairs.
The pairwise comparisons using the studentized range distribution are listed at the bottom of the output. If there is a significant difference, Yes is printed in red.
Note:
Uses the chi-square distribution to determine the p value.