Box and Whiskers Plot: Calculations Help
Home » SPC for Excel Help » Statistical Tools » Multiple Processes Help » Box » Box and Whiskers Plot: Calculations Help
The calculations are summarized below. These calculations are based on the article “Quartiles: How to Calculate Them?” by David Journet. In particular, the program uses the SAS method 4 outlined in the paper.
- Quartile
- Median
- Whiskers
- Plot of Q1, Q3, Median, Whiskers and Outliers

Quartiles
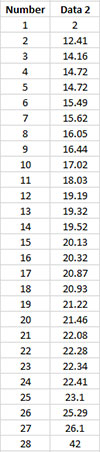
The quartiles are calculated as shown below. The data below has been sorted in ascending order. There are 28 data points.
The program uses:
- y = p(n+1) = j + g
where p the percentile (0.25 for Q1 or .075 for Q3), n = number of data points, j is the integer portion of y, and g is the decimal portion of y.
Q1
- y = 0.25*(28+1) = 7.25
- j = 7 which is the seventh point in the data in ascending order
- g = 0.25 which is the fraction to multiply the difference between Xj+1 and Xj (or in this case, the difference between point 8 and point 7).
- Q1 = 15.62 + 0.25(16.05 – 15.62) = 15.7275
Q3
- y = 0.75*(28+1) = 21.75
- j = 21 which is the twenty-first point in the data in ascending order
- g = 0.75 which is the fraction to multiple the difference between Xj+1 and Xj (or in this case, the difference between point 22 and point 21).
- Q3 = 22.08 + 0.75(22.28 – 22.08) = 22.23
Median
The median is calculated using Excel’s built-in median function (Median).
Whiskers
The upper whisker is the largest value in the data set that is less than the upper limit = Q3 + 1.5(Q3 – Q1)
The lower whisker is the smallest value in the data set that is greater than the lower limit = Q1 – 1.5(Q3 – Q1)
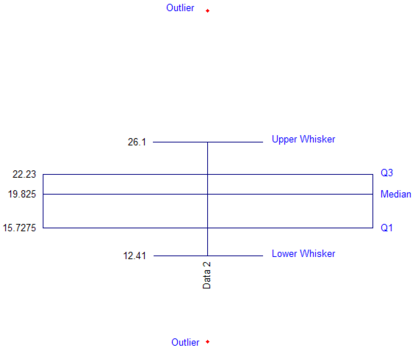
Plot of Q1, Q3, Median, Whiskers and Outliers