Chi Square Goodness of Fit Test Help
Home » SPC for Excel Help » Statistical Tools » Miscellaneous Tools Help » Chi Square Goodness of Fit Test Help
This test is used to determine if a set of data fits a particular distribution. The chi-square statistic is used to determine if this is true. The example below shows how to do this test using the SPC for Excel software.

Example (from Statistics and Data Analysis, by Ajit Tamhane and Dorothy Dunlop, Prentice-Hall, 2000)
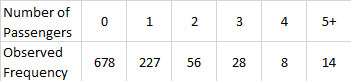
A 1959 study measured the number of passengers in a car in urban traffic at one intersection. The data are given below. Do these data represent a Poisson distribution? There are 1,011 observations.
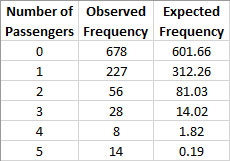
To use this technique, you must determine the expected frequency or number. To do this, first determine the average of the observed frequencies. This is defined as the following:
Average =[ (678*0)+(227*1)+(56*2)+(28*3)+(8*4)+(14*5)]/(678+227+56+28+8+14) = 0.519
You can use Excel’s Poisson function to find the expected values. For each number of passengers, use POISSON(x, 0.519, False) to find the expected value where x is the number of passengers. For example, for x = 0, the expected value is 602. Once this is complete, you can apply the Chi-Square Goodness of Fit test.
- 1. Enter the results into an Excel worksheet as shown below. The data can be downloaded at this link.
- 2. Select all the data in the table above including the headings.
- 3. Select “Misc. Tools” from the “Statistical Tools” panel on the SPC for Excel ribbon.
- 4. Select the “Chi Square Goodness of Fit” option and then OK.
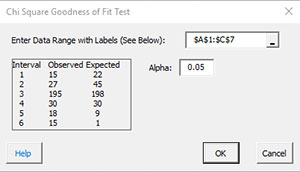
- Enter Data Range with Labels: enter the range containing the data and the labels; default is the range selected on the worksheet.
- Alpha: this is the confidence level; 1-alpha is the confidence interval. Default is 0.05 for 95% confidence.
- Select OK to generate the results.
- Select Cancel to end the program.
Chi Square Goodness of Fit Test Output
The output from the Chi Square Goodness of Fit Test is shown below.
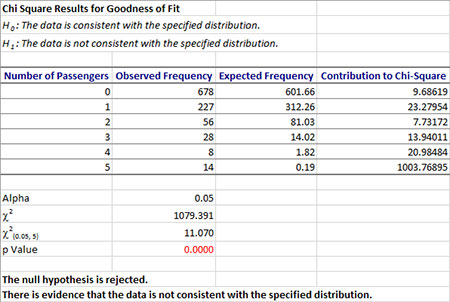
The null and alternate hypothesis are printed at the top of a new worksheet. The data are printed and the contribution to chi-square determine. The value of alpha is printed and the calculated and critical values for chi-square are calculated. The p value is determined. If it is less than 0.05, it is in red. The conclusion is then generated based on the values of p and alpha. In this example, the null hypothesis is rejected. There is evidence that the data does not follow a Poisson distribution.