Correlation Coefficients Help
Home » SPC for Excel Help » Statistical Tools » Correlation Help » Correlation Coefficients Help
The linear correlation coefficient, R, is a measure of the association between two variables. The maximum value for R is + 1. The minimum value for R is – 1. In both these cases, all sample points fall on a straight line. As R approaches +1 or -1, the stronger the correlation between x and y. The square of this coefficient indicates the fraction of variation in y that is associated with x. An example of this technique is given below.

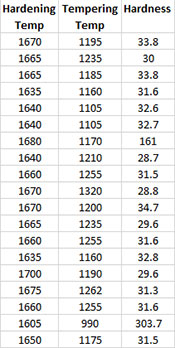
An engineer wants to know if there is a linear correlation between the hardening temperature, the tempering temperature, and the hardness of steel part. The data that has been collected is shown below.
- 1. Enter the data into a worksheet as shown below The data can be downloaded at this link.
- 2. Select the data and the headings.
- 3. Select “Correlation” from the “Statistical Tools” panel on the SPC for Excel ribbon.
- 4. Select the “Correlation Coefficients” option and then OK.
- 5. The following input box is used to enter the range containing the data and the headings. The default is the range selected on the worksheet.
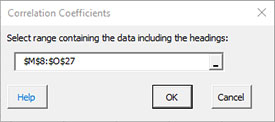
Select OK to generate the output.
Correlation Coefficient Output
A new worksheet is added with the following table:
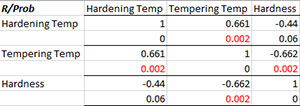
The variables are listed in the first row across and down the first column. For each pair of variables, the correlation coefficient is given on one row and the p value is given on the row below it. If the p value is < 0.05, it is highlighted in red. The two calculations are shown below.
Pearson’s Correlation Coefficient
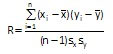
- n = number of paired data points for the variable x and the variable y
- sx = standard deviation of x
- sy = standard deviation of y
- Xbar= average of x
- Ybar= average of y
p Value
Determined from a two-tailed test using the t distribution with: