Non-Normal Ppk Charts Help
Home » SPC for Excel Help » Process Capability Help » Non-Normal Ppk Charts Help
The SPC for Excel performs non-normal capability analysis. The non-normal Ppk chart can be easily updated with new data. This page shows you how to make this type of chart using the data that can be downloadedat this link. This page contains the following:

Creating a New Non-Normal Ppk Chart
- 1. Select the data on the worksheet to be included in the analysis.
- 2. Select “Non-Normal Ppk” from the “Process Capability” panel on the SPC for Excel ribbon.
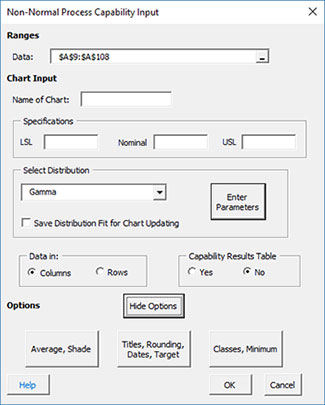
- 3. The input screen for the non-normal Ppk is displayed. The default data range is the range you selected on the worksheet. This will be the range that is included in the chart. You can edit the range if needed here. Three things must be entered before the chart can be made:
- Enter a name for the chart. This is the name that will be on the worksheet tab containing the chart. In this example, the name “Time” is used as the name of the chart
- Enter the specifications and the nominal (optional). At least one specification must be entered.
- Select the distribution to use (Gamma in this example).
The chart can be made by selecting OK. The various options on the input screen are shown below.
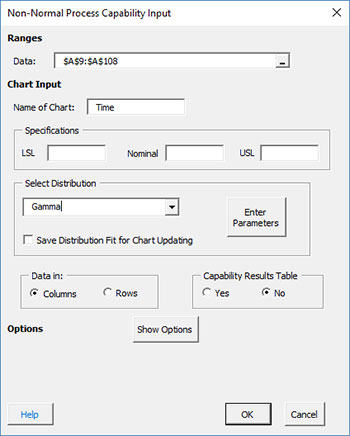
- Data: range containing the data to use in the Cpk Chart, may be edited if not correct
- Name of chart: chart name for worksheet tab containing the Cpk chart – must be a unique name in the workbook and is limited to 25 characters
- Specifications: the LSL, nominal and USL; at least one specification is required
- Select Distribution: the distribution may be selected from the drop-down box.
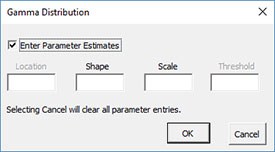
- Enter Parameters: you may enter the parameters for the distribution by selecting this button; otherwise the program will calculate the parameters
- Save Distribution Fit for Chart Updating: if this option is selected, the parameters will be saved and used when the chart is updated with new data.
- Data in: columns (subgroup is in one row across columns) or rows (subgroup is in one column across rows); the program uses this information to search for new data when updating the chart
- Capability Results Table: selecting this option places a summary of the process capability results into a summary worksheet; this worksheet contains all the process capability results for the workbook if this option was selected; default value is No.
- Show Options: selecting this button shows the various options for the non-normal Ppk chart (see options below)
- Average, Shade
- Titles, Rounding, Dates, Target, Classes
- Select OK to create the non-normal Ppk chart
- Select Cancel to exit the program
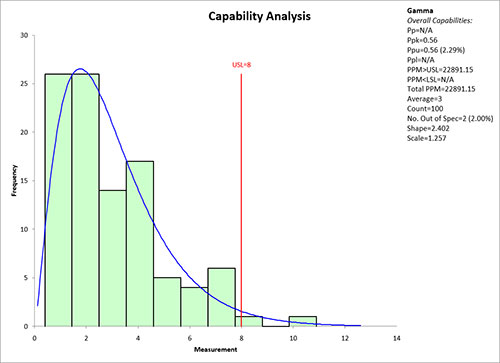
- 4. Once you have entered the information, select OK and the non-normal Ppk will be generated on a new chart sheet. An example based on the data above is shown below. Note that the chart is on the worksheet tab “Time”.
Distribution Options for Non-Normal Ppk
In the input screen above, there is a section titled “Select Distribution”. Selecting the arrow shows the available non-normal distributions:
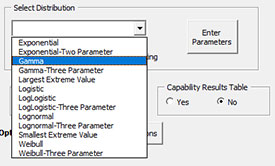
Select the distribution you want to use. If you are not sure which distribution fits best, you can run “Distribution Fitting” from the SPC for Excel ribbon. You can either chose to enter the parameters (if you have determined the parameters from distribution fitting) or let the program calculate the parameters. To enter the parameters, select the distribution you want (Gamma in this example) and select the “Enter Parameters” button. The screen below is displayed.
Options for the Non-Normal Ppk Chart
On the input screen for non-normal Ppk chart is the button labeled “Show Options”. If you select that button, the input screen will show the options for this chart. Each option is described below. It is not required to select any of these options.
Average, Shade
Selecting this option displays the input screen below.
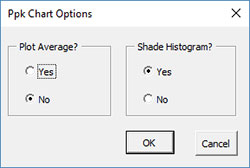
- Plot Average?: select Yes to plot the average; default is No
- Shade Histogram?: select Yes to shade the histogram; default is Yes
Titles, Rounding, Dates, Target, Classes
Selecting this option displays the input screen below.
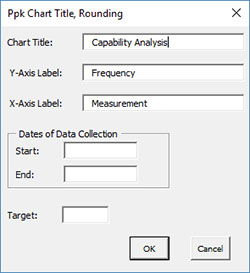
- Chart Title: the title for the Cpk chart, default is “Capability Analysis”
- Y-Axis Label: the label for the vertical axis; default is “Frequency”
- X-Axis Label: the label for the horizontal axis; default is “Measurement”
- Dates of Data Collection: option to enter starting and ending dates of data collection
- Number of Decimal Places for rounding: program estimates this based on the data
- Target: target for production; not necessarily the nominal; if entered Cpm is calculated
- Number of Histogram Classes: this option changes the number of bars used on the histogram
- Select OK to use selected options
- Select Cancel to revert to previous options
Updating the Non-Normal Ppk Chart with New Data
The Cpk Chart can be easily updated with new data after it has been added to the spreadsheet. Select the “Update Charts” on the Updating/Options panel on the SPC for Excel Ribbon.
Then select the chart you want to update. See Updating Charts for more information.
How SPC for Excel Finds New Data to Update the Non-Normal Ppk Chart
The program finds new data the same way it does for the Cpk chart. Please see the Cpk chart help page for information.
Changing the Options for the Non-Normal Ppk Chart
You can change the current options for a non-normal Ppk chart (e.g., adding the average) by selecting “Options” on the Updating/Options panel on the SPC for Excel Ribbon.
The list of available charts in the workbook will be displayed. Select the chart you want to change options for. The input screen for that chart will be shown and changes can be made. See Changing Chart Options for more information.