Multiple Cpk Charts Help
Home » SPC for Excel Help » Process Capability Help » Multiple Cpk Charts Help
SPC for Excel can make multiple Cpk charts at one time. This page shows you how to make a multiple Cpk charts using the data that can be downloadedat this link. Once each chart is made, it is handled like a Cpk chart made individually. This page contains the following:

The options listed for the multiple Cpk charts are the same as for the Cpk chart. Please refer to the help for Cpk Charts for information on those options and updating/changing options.
Data Entry
The data are entered into a worksheet as shown below (using the first part of the data into the example workbook). The data can be anywhere on the spreadsheet, but with the Multiple Cpk, the data must be in columns (one column for each set of data). In this example, there are four machines and we want to create a Cpk chart for each machine.
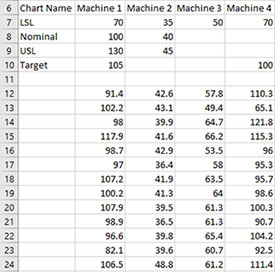
There must be a row for the chart names. These are the names of the charts that will appear on the worksheet tabs containing the chart. These names must be unique to the workbook and meet the requirements for naming a worksheet tab in Excel (maximum length, no characters such as “/”). There must be a name for each chart. In this example, the names are Machine 1, Machine 2, etc.
The data in the column under each chart name applies to that chart. The additional rows include LSL, Nominal, USL and Target. Only one specification is required. Under Machine 1, the LSL = 70, Nominal = 100, USL = 130, and Target = 105. If the target is entered, the value of Cpm is calculated. The data for the Cpk analysis are then listed in the column for that the machine.
Creating a Multiple Cpk Charts
- 1. Select the data for the first Cpk Chart on the worksheet to be included in the analysis.
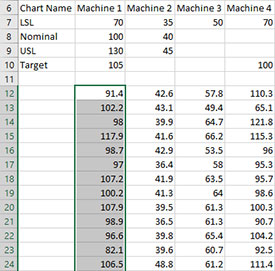
- 2. Select “Multiple Cpk” from the “Process Capability” panel on the SPC for Excel ribbon.
- 3. The input screen for the Multiple Cpk is shown. The default data range is the range you selected on the worksheet. This will be the range that is included in the Cpk chart. You can edit the range if needed here.
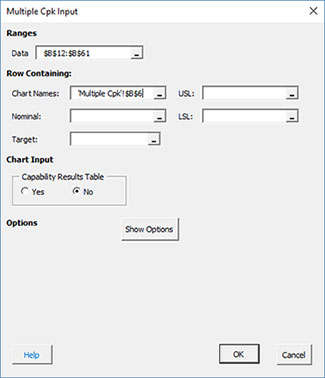
- Data: range containing the data to use in the first Cpk Chart, may be edited if not correct
- Chart Names: enter the row containing the chart names (select the row or a cell in the row)
- USL: enter the row containing the USL
- Nominal: enter the row containing the nominal
- LSL: enter the row containing the LSL
- Target: enter the row containing the target
- Capability Results Table: selecting this option places a summary of the process capability results into a summary worksheet; this worksheet contains all the process capability results for the workbook if this option was selected; default value is No.
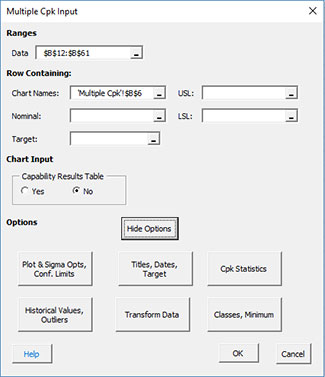
- Show Options: selecting this button shows the various options for the Cpk chart
- Sigma, Average, Shade
- Titles, Rounding, Dates, Target, Classes
- Outliers
- Transform Data
- Select OK to create the multiple Cpk Charts (one per worksheet tab)
- Select Cancel to exit the program
Options after Multiple Cpk Charts are Made
After the multiple Cpk charts are made, each is treated as single Cpk chart. See the Cpk Chart help page for the following: