Binomial Capability Help
Home » SPC for Excel Help » Process Capability Help » Binomial Capability Help
The binomial capability analysis is used to determine if the percentage of defective items in a process meets customer specifications. There are only two possible outcomes when you examine one item: it is either defective or not defective. So, you use this analysis with yes/no type attributes data. This analysis has the following output:
- % Defectives Histogram (with optional target value)
- p Control Chart
- Cumulative % Defective Chart
- % Defectives vs Subgroup Size Chart (if the subgroup size varies)
- P-P Plot (if the subgroup size is constant)
- Statistical Metrics
This page shows you how to perform the Binomial Capability Analysis using the data that can be downloaded at this link. This page has the following:

Data Entry
The data are entered into a worksheet as shown below (using the first part of the data into the example workbook). The data does not have to start in A1. It can be anywhere on the spreadsheet but must be in columns.
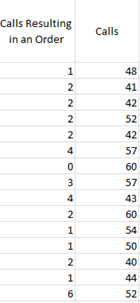
In this example, the percentage of calls that result in an order is being tracked. The data are collected daily. The first column is the number of calls made each day that result in order (np values). The second column is the subgroup size – the number of calls made that day (n). If there is a constant subgroup size, this range is not needed. You will enter the subgroup size below. The columns for np and n do not have to be together.
Creating a Binomial Capability Analysis
- 1. Select the data on the worksheet to be included in the analysis as shown by the shaded area above. You can also just put the cursor in the first cell of the data. The program will automatically select the data underneath that cell. You can also just put the cursor in the first heading. The program will use that as the name of the data and select the range underneath the heading.
- 2. Select “Binomial” from the “Process Capability” panel on the SPC for Excel ribbon.
- 3. The Binomial Capability form below shown.
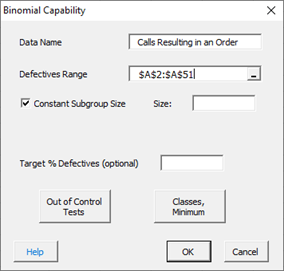
- Data Name: the name of the data, e.g., “number of calls resulting in an order”, this is optional
- Defectives Range: the range of the number of defective items; you can edit the range if needed here
- Constant Subgroup Size: default is yes, use a constant subgroup size
- Size: Enter the constant subgroup size if that option is selected
- Subgroup Size Range: the range of the subgroups if the size varies; this appears when the Constant Subgroup Size checkbox is unchecked; you can edit the range if needed here
- Target % Defective (optional): the target value for the % defectives
- Out of Control Tests: if selected, opens the form to select which tests to use for out of control conditions (see below)
- Classes, Minimum: options to create the histogram – number of classes, class width and lower class boundary (see below)
- Select OK to create the Binomial Capability Analysis
- Select Cancel to exit the program
If you uncheck the “Constant Subgroup Size” box in the form above, the subgroup range becomes visible as shown below:
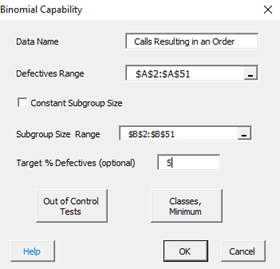
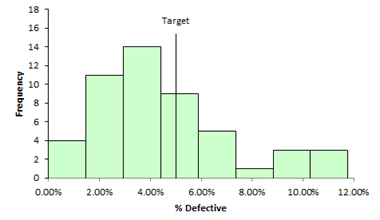
A target of %5 was added to the form in this example. The output from the analysis is described below.
Output for the Binomial Capability Analysis
The output from the analysis is placed a new worksheet. There are five parts to the output.
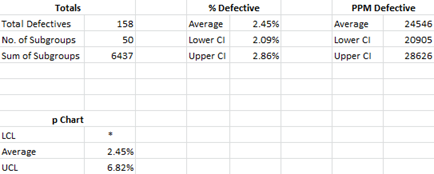
Statistical Metrics
This part of the output provides the statistical metrics from the analysis including average % defective and confidence interval associated with that average. The average % defective is the average percent defective in all the subgroups.
Histogram
The histogram shows the distribution of % defective items in the subgroups. If you entered a target values, it is plotted on the histogram to allow you to assess if most of the subgroups meet that target or not.
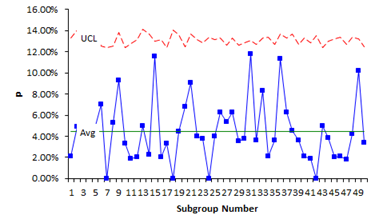
p Control Chart
The p control chart assesses the state of statistical control of the results. The center line is the average % defective. The two dotted lines are the upper and lower control points. The process is in statistical control if none of the selected control chart test above are violated. If the p control chart is in statistical control, the results are assumed to be valid. If there are too many out of control points, the process is not stable, and the results are not valid. Out of control points are in red.
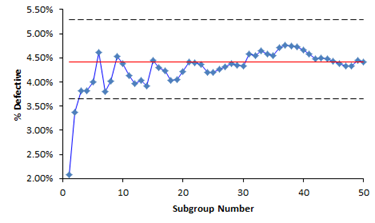
Cumulative % Defectives Chart
This chart plots the cumulative % defective over time for each subgroup. It is used to determine if you have enough subgroups for a valid estimate of the average % defectives. The center line is the average % defective (same as the center line on the p control chart). The upper and lower confidence limits for the average % defectives are also plotted. You want the data to flatten out along the average % defective line. If this occurs, you have enough subgroups.
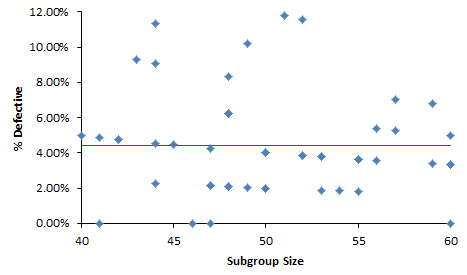
% Defectives vs Subgroup Size Chart
If the subgroup size varies, a % defectives vs subgroup size chart is included in the output. This chart plots the % defective against the subgroup size. It is used to help determine if the data comes from a binomial distribution. If it does, you would expect the points to be randomly distributed around the centerline, which is the average % defective.
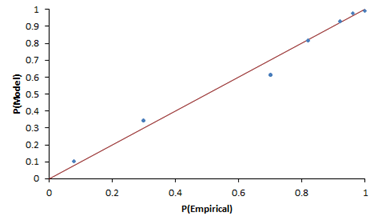
P-P Plot
If the subgroup size is constant, a P-P Plot is included in the output. This P-P Plot is used to determine if the data comes from a binomial distribution. The P-P Plot plots the empirical cumulative distribution function (CDF) values (based on the data) against the theoretical CDF values (based on the binomial distribution). If the P-P plot is close to a straight line, then the binomial distribution fits the data.
Options for the Binomial Capability Analysis
There are two options on the input form shown above: Out of Control Tests and Classes, Minimum. Both are described below.
Out of Control Tests
Selecting this option displays the input screen below. These options apply to the p control chart which is used in the Binomial Capability Analysis. This defines what out of control tests to apply to the control chart.
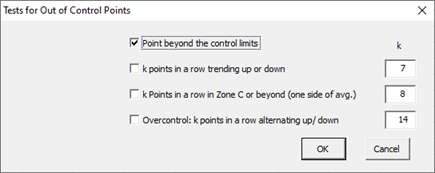
- Point beyond the control limits: out of control if a point that is above the upper control or below the lower control
- k points in a row trending up or down: out of control if there are k points in a row trending upward or trending downward; two points in a row that are equal break this trend
- k points in a row in Zone C or beyond (one side of avg): Zone C is the zone between the average and one standard deviation above the average on the top half of the chart and the average and one standard deviation below the average on the bottom half of the chart; out of control if there is a run of k points in a row above or below the average
- Overcontrol: k points in row alternating up and down: out of control if k points in a row are such that the values alternate up and down
Classes, Minimum
If you select the “Classes, Minimum” option, the following input screen will appear:
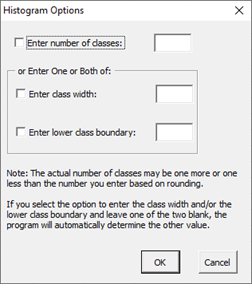
- Enter number of classes: this option sets the number of classes (bars) on the histogram
- Enter class width: this option changes the width of the classes (bars)
- Enter lower class boundary: this option sets the lower boundary on the histogram
- Select OK to use selected options
- Select Cancel to revert to previous options