Basic Histogram Help
Home » SPC for Excel Help » Histograms Help » Basic Histogram Help
The Basic Histogram is a picture of how often a value or range of value occurred in a data set. The histogram can be easily updated with new data. This page shows you how to make a Basic Histogram. The data can be downloaded at this link. This page contains the following:

- Data entry
- Creating a new Basic Histogram
- Options for the Basic Histogram
- Updating the Basic Histogram with new data
- How SPC for Excel finds new data to update the Basic Histogram
- Changing the options for the Basic Histogram
- Changing the number of classes, starting point, or class width on the Basic Histogram
Creating a New Basic Histogram
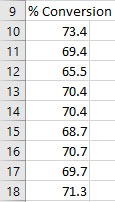
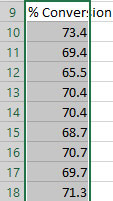
- 1. Select the data on the worksheet to be included in the analysis.
- 2. Select “Basic” from the “Histograms” panel on the SPC for Excel ribbon.
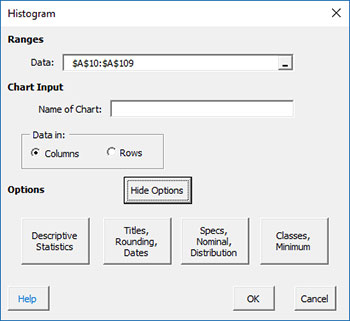
- 3. The input screen for the Basic Histogram is shown. The default data range is the range you selected on the worksheet. This will be the range that is included in the histogram. You can edit the range if needed here. Enter a name for the chart. This is all that is needed to make the histogram. This is the name that will be on the worksheet tab containing the histogram. In this example, the name “Conversion” is used as the name of the histogram.
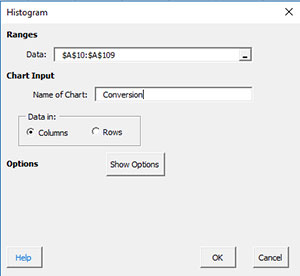
- Data: range containing the data to use in the histogram, may be edited if not correct
- Name of chart: chart name for worksheet tab containing the Basic Histogram – must be a unique name in the workbook and is limited to 25 characters
- Data in: the program uses this information to search for new data when updating the chart (see below)
- Show Options: selecting this button shows the various options for the Basic Histogram (see options below)
- Descriptive Statistics
- Titles, Rounding, Dates
- Specs, Nominal, Distribution
- Select OK to create the Basic Histogram
- Select Cancel to exit the program
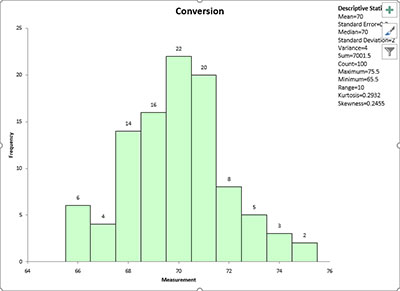
- 4. Once you have entered the information, select OK and the histogram will be generated on a new chart sheet. An example based on the data above is shown below.
Options for the Basic Histogram
On the input screen for the basic histogram, there is the button labeled “Show Options”. If you select that button, the input screen will show the options for the Basic Histogram. Each option is described below. It is not required to select any of these options.

Descriptive Statistics
If you select this option, you will get the input screen below. This option places on the descriptive statistics for the data into the upper-right hand corner of the histogram.
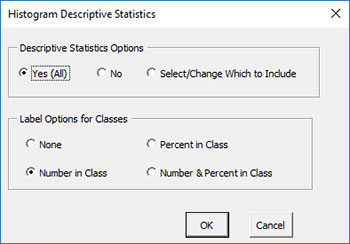
- Yes(All): will display all descriptive statistics
- No: will not display any descriptive statistics (default)
- Select/Change Which to Include: select which descriptive statistics to include
- Select OK to use selected options
- Select Cancel to revert to previous options
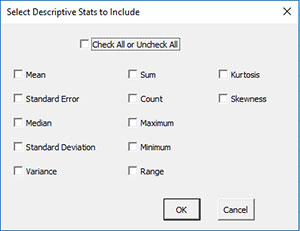
When “Select/Change Which to Include” is selected and OK is selected, the input screen below is shown. You can select which descriptive statistics to display on the chart using this.
Titles, Rounding, Dates
If you select this option, the following input screen is shown.
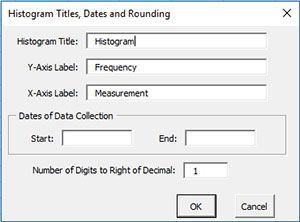
- Histogram Title: the title placed on the chart; default is “Histogram”
- Y-Axis Label: label for vertical axis; default is “Frequency”
- X-Axis Label: label for horizontal axis; default is “Measurement”
- Dates of Data Collection: option to enter starting and ending dates of data collection
- Number of Digits to Right of Decimal: program estimates this based on the data; impacts the rounding on the x-axis
- Select OK to use selected options
- Select Cancel to revert to previous options
Specs, Nominal, Distribution
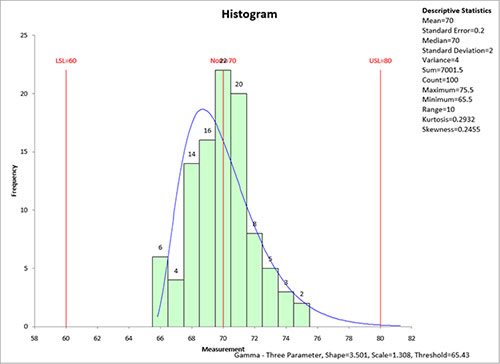
If you select his option, the following input screen is shown. The default distribution is “None”. The “Select Distribution” frame is not shown unless the “Non-Normal” option is selected.
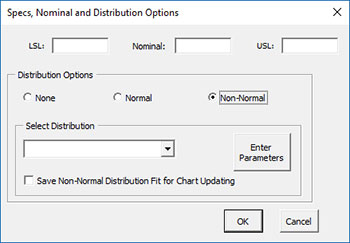
- LSL: lower specification limit (optional)
- Nominal: nominal value (optional)
- USL: upper specification limit (optional)
- Distribution Options
- None: no distribution is added to the chart
- Normal: normal distribution is added to the chart
- Non-Normal: the selected non-normal distribution is added to the chart
- Select Distribution: shown if the “Non-Normal” distribution option is selected; click down arrow to select distribution (see below)
- Save Non-Distribution Fit for Chart Updating: stores the distribution parameters to be used when the histogram is updated with new data
- Enter Parameters: option to manually enter the parameters for the selected distribution (see below)
- Select OK to use selected options
- Select Cancel to revert to previous options
To select a non-normal distribution, select the down arrow in the box below “Select Distribution”. The available distributions are then listed. Select the one you want to use.
If you select the “Enter Parameters” option, the input screen below is shown. Select “Enter Parameter Estimates” and the available parameters for the selected distribution will be enabled. The four parameters are location, shape, scale and threshold. Not all four parameters are valid for each distribution. The example below shows the parameters available for the three parameter Gamma distribution.
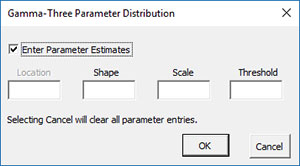
- Enter Parameter Estimate: select to manually enter the parameter estimates
- Select OK to use selected options
- Select Cancel to clear all parameter entries.
The example shows the results for the three parameter gamma distribution for the conversion data shown above. The parameter estimates are placed in a text box in the bottom right hand side of the chart.
Updating the Basic Histogram with New Data
The Basic Histogram can be easily updated with new data after it has been added to the spreadsheet. Select the “Update Charts” on the Updating/Options panel on the SPC for Excel Ribbon.
Then select the chart you want to update. See Updating Charts for more information.
How SPC for Excel Finds New Data to Update the Basic Histogram
When a chart is updated, the program will search for new data based on the option selected for the data being in columns or rows (see the first input screen above). If the data are in columns, the program starts with the first cell in the existing histogram range and searches down the column to find the last entry before an empty cell. Once an empty cell is found, it is assumed that there is no more data. If the data are in multiple columns, the first column is used. The same process applies if the data are in rows.
Changing the Options for the Basic Histogram
You can change the current options for a histogram (e.g., to add specs or change the type of distribution) by selecting “Options” on the Updating/Options panel on the SPC for Excel Ribbon.
The list of available charts in the workbook will be displayed. Select the chart you want to change options for. The input screen for that chart will be shown and changes can be made. See Updating/Options for more information.
Changing the Number of Classes, Starting Point, or Class Width on the Basic Histogram
After a histogram is made, you may want to change the number of classes (bars), the starting point, or the class width. To do this, follow the instructions above for “Changing the Options for the Basic Histogram”. When you select the chart from the list and select OK, the input screen below will appear. Note that there is a new option: “Classes, Minimum”.
If you select the “Classes, Minimum” option, the following input screen will appear:
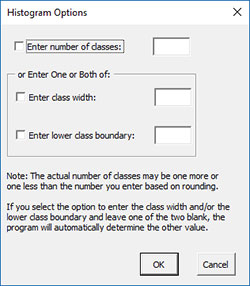
- Enter number of classes: this option sets the number of classes (bars) on the histogram
- Enter class width: this option changes the width of the classes (bars)
- Enter lower class boundary: this option sets the lower boundary on the histogram
- Select OK to use selected options
- Select Cancel to revert to previous options
The options selected here will remain when the histogram is updated with new data.