Table X-mR and Table X Help
Home » SPC for Excel Help » Control Charts Help » Variable Control Charts Help » Individual Charts Help » Table X-mR and Table X Help
The Table X-mR option and the Table X Chart allows you to make multiple X-mR charts or X charts at one time. This page explains how to do this using the data that can be downloaded at this link. This help pages shows the Table X-mR instructions but the Table X chart is done the same way. There are two options with the Table X-mR: to treat the data as single X-mR charts (if they will have different options) or to create multiple X-mR charts with the same options. This page contains the following:

Before running the Table X-mR it is recommended that you review X-mR (Individuals) charts to understand how X-mR charts are developed and the options available.
Data Entry
The data are entered into a worksheet as shown below (using the first part of the data into the example workbook). The data does not have to start in A1. It can be anywhere on the spreadsheet. The data can be in rows or in columns. With an individuals chart, there is only value of X for a given sample (time period).
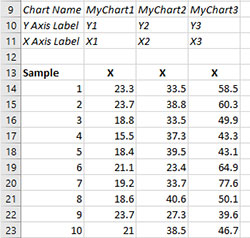
The data entry example above has the data in columns (sample identifier and result are in one row across columns). The sample identifiers are in one column (under “Sample”). There are three charts that will be made from this data. You can have as many charts in the Table X-mR as you want. The data for each individual chart is shown under the headings X1, X2 and X3. This is all the data entry you need if you select the option to “show input for each X-mR chart” (see below). This is the option you will use if your single X-mR charts will have different options.
If all the X-mR charts will have the same options, you will need to add some additional information to the worksheet for the second option. The “Chart Names” are listed in one row (row 9 in this example) above. This the name of the chart that will appear on the worksheet tab must be unique. The first chart is named “MyChart1”. You must have the “Chart Names” information. The information for that chart is under that heading. The “Y Axis Label” and the “X Axis Label” are one row also (rows 10 and 11 in this example). These are optional as well as for the mR Chart (see below; in this example, the mR Chart axis information was not included)
Running the Table X-mR
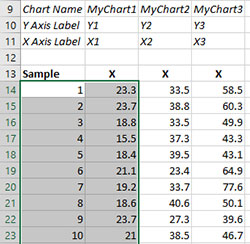
- 1. Select the sample identifiers and data for the first chart as shown below.
- 2. Select “Variable” from the “Control Charts” panel on the SPC for Excel ribbon.
- 3. The input screen for variable control charts is displayed. The Table X-mR is listed on the second tab (Individuals Charts) of input screen.
- 4. When you select the Table X-mR, you will get the input screen below. There are two options: 1) show input for each X-mR chart or 2) show first input form; run rest of X-mR charts with the same options and the following:.
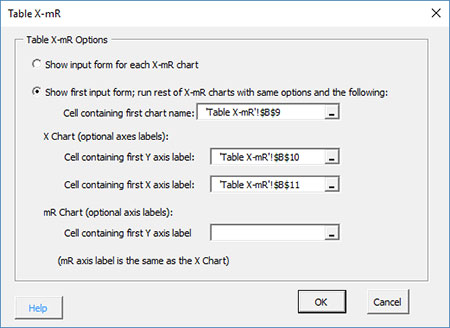
- Show input form for each X-mR chart: selecting this option will show the X-mR input form for each chart you want to make; each chart in the Table X-mR is treated as an single individuals chart; see for more information; select this option if each individual control chart will have different options.
- Show first input form; run rest of X-mR charts with same options and the following: selecting this option will show in the X-mR input form for just the first chart; the rest of the X-mR charts will have the same options
- Cell containing the first chart name: select the cell that contains the first chart name (MyChart1 in this example); chart names are required
- X Chart (optional axes labels):
- Cell containing the first Y axis label: select the cell that contains the first Y axis label for the X Chart; this is optional; if left blank, the default labels will be used.
- Cell containing the first X axis label: select the cell that contains the first X axis label for the X Chart; this is optional; if left blank, the default labels will be used.
- mR Chart (optional axes labels):
- Cells containing first Y axis label: select the cell that contains the first Y axis label for the mR Chart; this is optional; if left blank, the default labels will be used.
- Select OK to start the Table X-mR
- Select Cancel to exit the software
Note: if you select the first option to show the input form for each X-mR chart, you do not need to have the chart names and optional axes labels entered into the worksheet.
- 5. After you select OK, you will see the input screen for the X-mR Chart (for each chart for the first option; just for the first chart with the second option). After the X-mR Charts are made, they are updated/changed as single X-mR charts.