Reset Chart’s Value (Y) Axis Help
Home » SPC for Excel Help » Control Charts Help » Control Chart Actions » Chart Actions » Reset Chart’s Value (Y) Axis Help
You would like to start the control chart a point 11. You do this by following these steps:
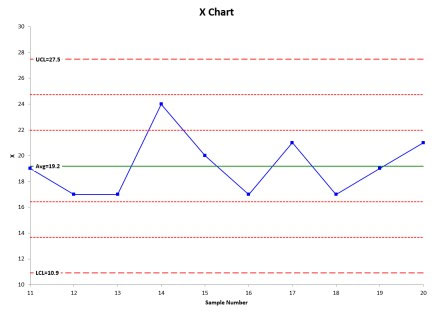
- 1. Select the chart. Below is an example of an X chart that has a Y-axis minimum of 10 and maximum of 30.

- 2. Select “Actions” in the “Control Charts” panel on the SPC for Excel ribbon to display the Control Chart Actions form.
- 3. Select the “Rest chart’s value axis” option.
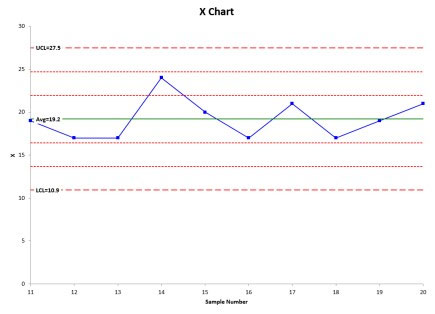
- 4. Select OK on the “Control Chart Actions” form. The chart’s Y axis minimum and maximum are set to Excel’s automatic setting. The Y axis minimum is 0 in this example; the maximum stayed the same.

