Stepwise Regression Help
Home » SPC for Excel Help » Cause and Effect Help » Stepwise Regression Help
This page shows how to perform stepwise regression using SPC for Excel. This page contains the following:

Example
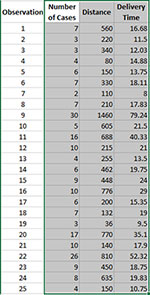
We will use an example from Montgomery’s regression book. An engineer employed by a soft drink beverage bottler is analyzing what impacts delivery times. He decides the two factors that impact the time could be the number of cases a driver delivers, as well as how far the driver has to walk at the customer’s facility. He has collected 25 observations for delivery time (minutes), the number of cases, and distance walked (feet). The data are shown below. We want to use this data to determine if either factor impacts delivery time and if we can build a model to predict delivery time. The steps below show how to do this using the SPC for Excel software. In this example, we are using the following model:
Y = bo + b1x1 + b2x2
where:
- Y = response variable (delivery time)
- x1 = predictor 1 (number of cases)
- x2 = predictor 2 (distance walked)
- bo = intercept
- b1 = coefficient for predictor 1
- b2 = coefficient for predictor 2
Data Entry
Enter the data into a spreadsheet as shown below. The data can be downloaded here. The data must be in columns with the variable names in the first cell of the column.
Running the Regression
- 1. Select the shaded area (including the headings). You can use “Select Cells” in the “Utilities” panel of the SPC for Excel ribbon to quickly select the cells.
- 2. Select “Regression” from the “Cause and Effect” panel on the SPC for Excel ribbon.
- 3. The regression input screen is shown below. The ranges you selected above are the default values assuming that the Y values are in the last column.
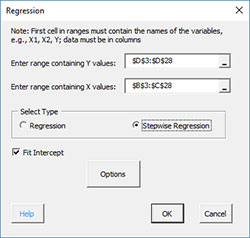
- Enter range containing Y values: the worksheet range containing the Y values
- Enter range containing X values: the worksheet range containing the X values
- Select Stepwise Regression
- Fit intercept: default is that the intercept will be fitted; unchecking the box will set the intercept to 0.
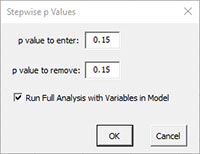
- Options: contains the p values to enter and remove variables
- Select OK to generate the stepwise regression.
- Select Cancel to exit the SPC for Excel program
Stepwise Regression Output
A new worksheet is added that contains the stepwise regression output. The variables tested are listed at the top. Each step in the stepwise regression is then given. It will tell if the variable was added or removed and give the coefficient, the t statistic, and the p value for each variable included in the model. It will also give the value of sigma, R2 and R2 adjusted.
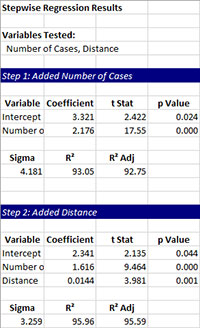
After finding the best model, the software generates the regression output.