Forward Selection Regression Help
This page shows how to perform forward selection regression using SPC for Excel.
Forward selection is a stepwise regression that begins with an empty model. Variables are then added in one by one. You add the variable that gives the most improvement in the model, based on the p-value. You stop adding variables when the model does not improve with the addition of more variables. This page contains the following:

Data Entry
Enter the data into a spreadsheet as shown below. The data can be downloaded here. The data must be in columns with the variable names in the first cell of the column. There are five factors that a researcher believes may impact the output variable Y. Please see this link to see how SPC for Excel handles categorical predictors if you have them.

Running the Forward Selection Regression
- 1. Select the data and the headings. You can use “Select Cells” in the “Utilities” panel of the SPC for Excel ribbon to quickly select the cells.
- 2. Select “Regression” from the “Cause and Effect” panel on the SPC for Excel ribbon.
- 3. Select "Forward Selection."
- 4. The input form below is shown.
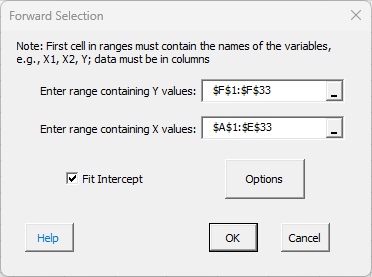
- Enter range containing Y values: the worksheet range containing the Y values
- Enter range containing X values: the worksheet range containing the X values
- Fit intercept: default is that the intercept will be fitted; unchecking the box will set the intercept to 0.
- Options: selecting this displays the form below.
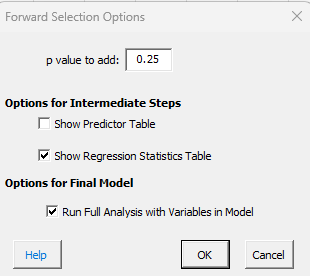
- Enter the p value to determine if a variable can be entered into the model; default is 0.25, which means a variable must have a p value less than 0.25 to be entered into the model.
- Show Predictor Table: if this option is selected, the predictor’s table for each iteration of the model will be displayed on the forward selection worksheet; the table is shown in the output below; default is not to show this table for iteration.
- Show Regression Statistics Table: if this option selected, which is the default, the regression statistics table is displayed; the table contains R2, Mallow’s CP as well as other statistics; the table is shown in the output below.
- Run Full Analysis with Variables in the Model: if selected, which is the default, a full regression analysis is run on the final model; this is the same as running multiple regression for the final model.
- Select OK or Cancel to return to the first input form.
- Select OK to run the regression or Cancel to end.
Forward Selection Regression Output
A new worksheet is added that contains the forward selection regression output as shown below.
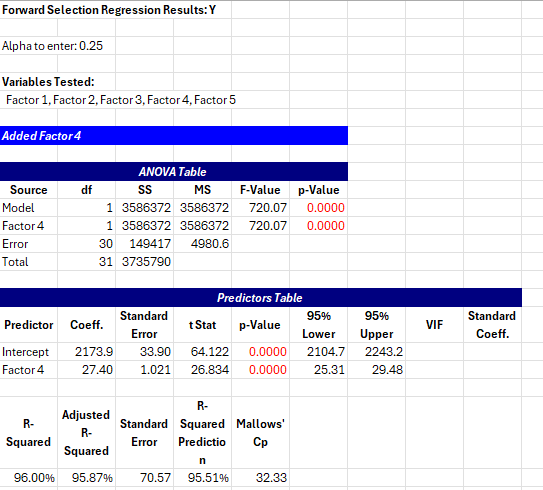
- The alpha to enter is given based on user's input.
- The variables tests are listed.
- The first factor entered is listed.
- The ANOVA table for the current model is displayed; the ANOVA table is shown for each iteration.
- The predictor's table is given if that option was selected.
- The regression statistics table is given if that option was selected.
Once no more variables can be added, the program ends unless the option to run the full regression analysis on the selected model was selected and the software generates the full regression output.