Best Subsets Regression Help
Home » SPC for Excel Help » Cause and Effect Help » Best Subsets Regression Help
This page shows how to perform best subsets regression using SPC for Excel.
Best subsets regression compares all possible models based on a given set of predictors. The results are compared against some value for each model. For example, you might use R2 to determine which model appears to be the best.
This page contains the following:

Data Entry
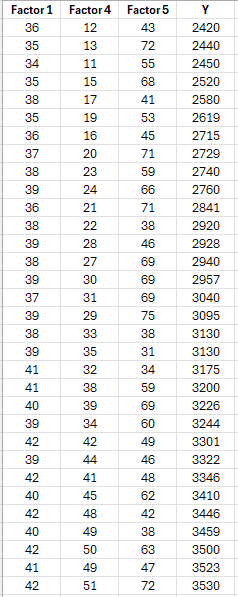
Enter the data into a spreadsheet as shown below. The data can be downloaded here. The data must be in columns with the variable names in the first cell of the column. Categorical predictors are not allowed with the best subsets method.
Suppose there are thee factors that a researcher believes may impact the output variable Y.
Running the Forward Selection Regression
- 1. Select the data and the headings. You can use “Select Cells” in the “Utilities” panel of the SPC for Excel ribbon to quickly select the cells.
- 2. Select “Regression” from the “Cause and Effect” panel on the SPC for Excel ribbon.
- 3. Select "Best Subsets."
- 4. The input form below is shown.
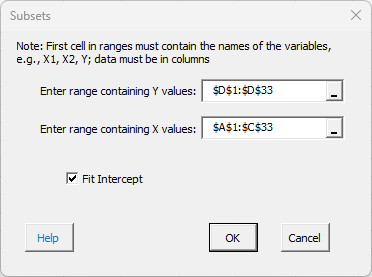
- Enter range containing Y values: the worksheet range containing the Y values
- Enter range containing X values: the worksheet range containing the X values
- Fit intercept: default is that the intercept will be fitted; unchecking the box will set the intercept to 0.
- Select OK to run the regression or Cancel to end.
Best Subsets Regression Output
A new worksheet is added that contains the best subsets regression output as shown below.
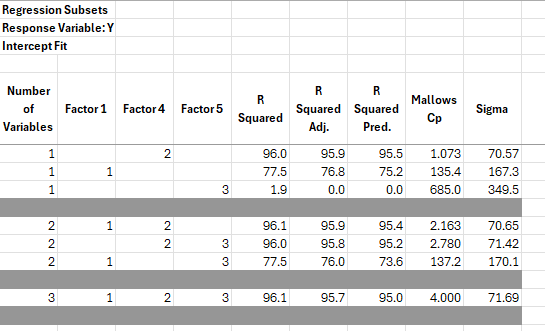
The first column is the number of variables in the model. The next column shows which variables are in the model. The statistics to judge the models are then given: R2, Adjused R2, Predicted R2, Mallows Cp and Sigma.