Attribute Gage R&R Help
This page shows how to setup and run the Attribute Gage R&R. The data can be downloaded at this link.
- 1. Select “MSA” from the “Analysis” panel on the SPC for Excel ribbon. Then select “Gage R&R Studies” and “Attributes”.
- 2. Select OK and the input screen below is displayed. Fill in the information.
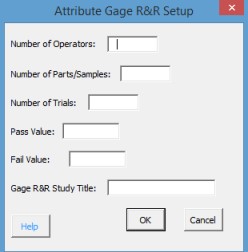
- Number of Operators
- Number of Parts
- Number of Trials
- Pass Value: the pass value used in the data (e.g., Pass or 1)
- Fail Value: the fail value used in the data (e.g., Fail or 0)
- Enter Gage R&R Study Title: this is the title that will appear on various worksheets
- Select OK and the template is generated.
- Select Cancel to end the program.
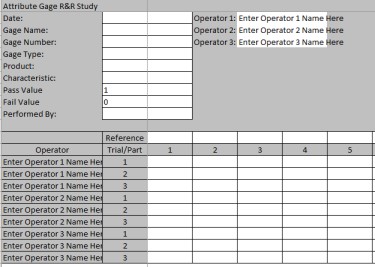
- 3. When you select OK, a blank template is created on a new worksheet. This template below is for 3 operators, 50 parts and 3 trials. Just a portion of the template is shown. The pass value = 1 and the fail value = 0.
- 4. Fill in the blank template. A completed template is shown below. Enter the operator names in the upper right hand corner. The names will automatically appear in the first column.
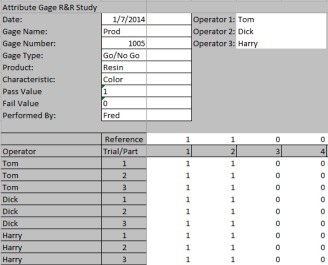
- 5. Enter the rest of the information for Date, Gage Name, Gage Number, Gage Type, Product, Characteristic, and Performed By. Enter the data from the operators for each trial and each part. Note: the worksheet is protected except for the cells where you enter information or data. You are now ready to analyze the Attribute Gage R&R results.
- 6. Start on the worksheet containing the template with your data entered. Select “MSA” from the “Analysis” panel on the SPC for Excel ribbon.
- 7. A form shows saying that selecting OK with run the analysis. Select OK and the analysis will be performed.
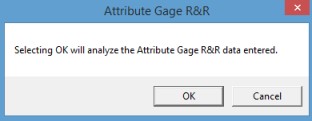
- 8. The Attribute Gage R&R analysis consists of three worksheets:
- Effectiveness Report
- CrossTab
- Kappa
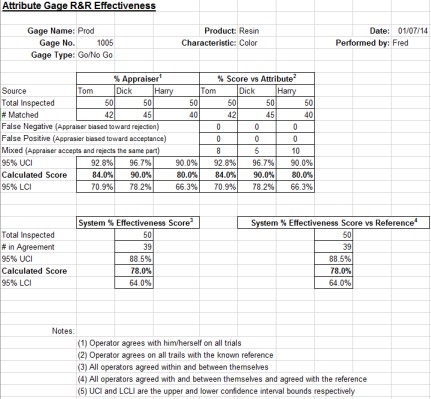
- 9. The Effectiveness Report worksheet is shown below. This report determines how effective each operator is. If the calculated score for each operator falls within the confidence interval of the other operators, the effectiveness of the operators is the same.
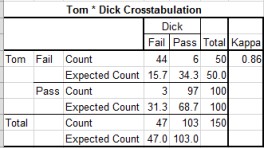
- 10. The CrossTab worksheet contains a cross tabulation table for each combination of operators. The table for Tom and Dick is shown below. The kappa value is given. If kappa is above 0.75 there is good agreement between the operators. If it is less than 0.40, there is poor agreement. These tables will help you determine how well the operators agree with one another.
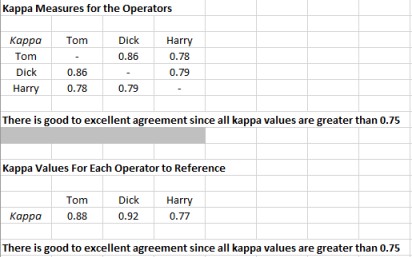
- 11. The Kappa worksheet contains the output for Kappa values is shown below. It includes the kappa values for the operators as well as the kappa value compared to the reference values .
