Two Level Designs: Setup Help
Home » SPC for Excel Help » Analysis Help » DOE (Design of Experiments) Help » Two Level Designs: Setup Help
This procedure applies to the full factorial designs, the fractional factorial designs, and the Plackett-Burman designs. There are some slight differences between the three.
To understand how the design is set up, we will use an example from Montgomery’s book on experimental design (Montgomery, D.C., Design and Analysis of Experiments, 6th Edition, John Wiley & Sons, 2005). The data can be downloaded here. The example involves a 23 full factorial design that is used to develop a nitride etch process on a single-wafer plasma etching tool. There are three design factors:
- Gap between the electrodes in centimeters (0.8, 1.2)
- C2F6 gas flow in SCCM (125, 200)
- RF power applied to the cathode in watts (275, 325)
Each factor was run at two levels shown above and the experiment was replicated twice. The response variable is the etch rate for silicon nitride. The steps below are used to setup the experimental design template so that the results can be entered.
- 1. Select “DOE” in the “Analysis” panel inf the SPC for Excel ribbon.
- 2. Select the “Full Factorial Design (Two Level)” option.
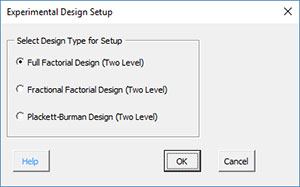
- Select OK. Fill in the input form below.
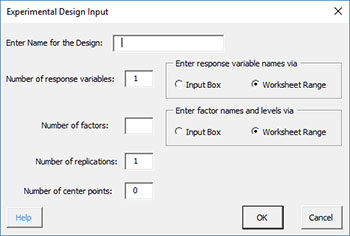
- 4. Select OK and you will see forms to input the names and levels based on the option you selected above. It is recommended that you use the worksheet range method to enter the names and levels. Both are explained below.
Input Box Option
If you select this option for the response variables, you will see the form below. Enter the name for the response variable. You will get this form for each response variable.

If you select this option for the factors, you will see the form below. Enter the factor names, low levels and high levels. The levels must be numeric.
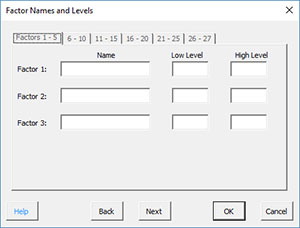
Worksheet Range
If you select this option, you must have the names and levels entered into a spreadsheet already. For example, you could use the layout below.
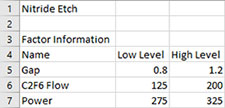
You will get the following two forms to select the worksheet ranges containing the names of the response variables as well as the factor names and levels.
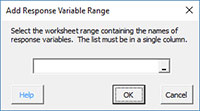
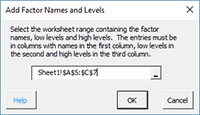
- 5. When you are finished entering the names and levels, the program generates a new worksheet with the experimental design layout as shown below.
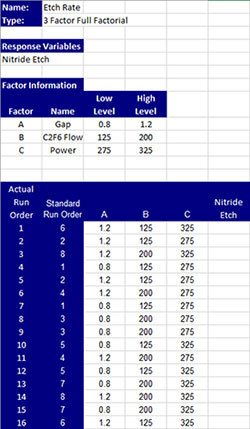
The top part of the worksheet contains the name of the design, the type of design, response names as well as the factor names and levels. The bottom of the worksheet contains the experimental runs in randomized order. There is a blank range under each response variable to enter the results.
The results for this example are entered as shown below.
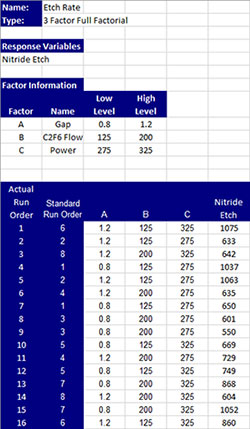
You are now ready to run the analysis.
