Two Level Designs: Analysis Help
Once the experimental design has been run and the results entered into the worksheet, you are ready to analyze the results.

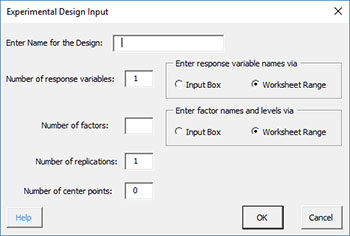
Each factor was run at two levels shown above and the experiment was replicated twice. The response variable is the etch rate for silicon nitride. The steps below are used to setup the experimental design template so that the results can be entered.
- 1. Select “DOE” in the “Analysis” panel inf the SPC for Excel ribbon.
- 2. Select “Analyze Two Level Experimental Designs” on the “Analyze Experimental Design” page.
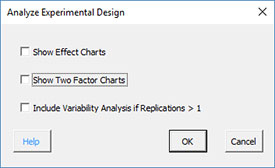
- Select from the following options:
- Show Effect Charts: these charts contrast the high and low level effects for each factor and interaction
- Show Two Factor Charts: these charts show the relationship between each pair of factors
- Include Variability Analysis if Replications > 1: this option will generate a separate analysis of the range results to determine what factors/interactions impact variability
- 3. Select OK. The program will perform the analysis. A new workbook is created and the data are transferred into the workbook. All the calculations and output is done in the new workbook. The output from the analysis is described below.
- DOE Data
- This worksheet contains the data that was transferred from the original workbook
- This worksheet contains the data for all the factors/interactions including:
- Design table analyzed using Yates’ Algorithm
- Range chart results if replications were run
- ANOVA table based on all factors and interactions
- ANOVA for the model (containing all the factors)
- Average, standard deviation, coefficient of variation, R2, adjusted R2, PRESS and R2 prediction
- Factor information include coefficient, degrees of freedom, standard error, and 95% confidence limits
- Model containing all factors based on coded and actual levels
- This worksheet contains various residuals:
- Observation Number
- Observed Value
- Predicted Value
- Raw residuals
- Leverage
- Standardized residuals
- Internally studentized residuals
- Externally studentized residuals
- DFFITS
- Cook’s distance
- Residual plots for each type of residual (raw, standardized, internally studentized, externally studentized)
- Normal plot of residuals
- Residuals versus predicted results
- Residuals versus actual run number
- Other plots
- Leverage versus actual run number
- DFFITs versus actual run number
- Cook’s distance versus actual run number
- Predicted values versus predicted values
Details on each worksheet (except for DOE Data worksheet which contains the raw data) are given via the links above for multiple replications. The output for a single replication is very similar.