Running the ANOVA Help
Home » SPC for Excel Help » Analysis Help » ANOVA Help » Running the ANOVA Help
This sheet contains the half-normal plot of effects as shown below. The absolute value of the effects is used in this plot.

- 1. Select the worksheet containing the ANOVA results.
- 2. Select “ANOVA” in the “Analysis” panel in the SPC for Excel ribbon.
- 3. The ANOVA output options form is shown. There are seven options always available and one additional option if all the factors are fixed.
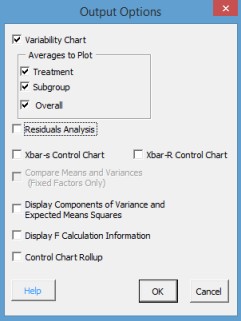
- Variability Chart: this chart plots the treatment results versus the factor settings; there are options to plot the treatment averages and the overall average
- Residuals Analysis: this option generates a table of various residuals as well as charts; useful for finding outliers
- Xbar-s Control Chart: this option generates an Xbar-s control chart based on the treatments
- Xbar-R Control Chart: this option generates an Xbar-R control chart based on the treatments
- Compare Means and Variances (Fixed Factors Only): this option allow you to compare treatment means and variances to determine if there are any difference; click here for more information on this option
- Display Components of Variance and Expected Mean Squares: this option will calculate the components of variance for all factors, show the expected mean squares, and graph the % variance by component. Note that this normally used for random factors only, although the program will show the results for fixed factors as well
- Display F Calculation Information: this option will show how the F value is calculated for each term; it includes the mean square error as well as the degrees of freedom for the error term used in the mean square calculation.
- Control Chart Rollup: this option is very useful for nested designs; it builds a control chart for each level in the design.
- 4. Select the options you want and select OK. The program will generate the ANOVA output.