Residuals Analysis (ANOVA)
Home » SPC for Excel Help » Analysis Help » ANOVA Help » ANOVA Output Help » Residuals Analysis (ANOVA)
This worksheet contains a table with the residuals analysis. A portion of the table for this example is shown below. The columns are described below. p is the number of terms in the model; n is the number of runs. Note: if you rerun an ANOVA in a workbook that already exists, the worksheet “Residuals” as well as the chart sheet “Residual Plots” will be replaced with the new data.

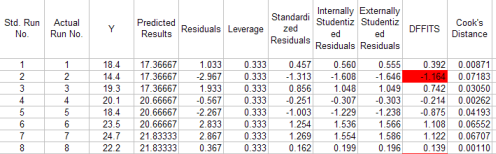
Standard Run Number: the run number assigned by the program during the design setup.
Actual Run Number: the actual run number assigned by the program during the design setup; will be the same as the standard run number if the option to randomize the runs was not selected.
Predicted Value: the value of the response variable predicted from the model containing all the sources of variation
Residual: the difference between the observed value and the predicted value
Leverage: the amount of leverage (influence) the run has on the predicted value; the leverage values are obtained from the diagonal element of the hat matrix; if the leverage for a run is greater than 2p/n, then this run is a high-leverage point and should be investigated further; p is the number of terms in the model and n is the number of runs; the hat matrix is given by H=X(X’X)-1X’
Standardized Residuals: provides a rough check for outliers; determined by dividing each residual by the square root of the mean square error; any value outside +/- 3 is a possible outlier
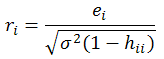
Internally Studentized Residuals: take into account the inequality of variances across the factor space, any value outside +/-3 is a possible outlier, defined as (sigma squared is the mean square error):
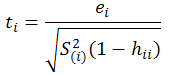
Externally Studentized Residuals: uses a different estimate of sigma than MSE in the above equation; estimates sigma based on a data set with the ith observation removed:
The externally studentized residual is the defined as (any value outside +/- 3 is a possible outlier):
DFFITS: measures the deletion influence of run i; if absolute values is greater than 2*sqrt(p/n) , the run is influential
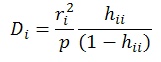
Cook’s Distance: indicates the difference between the calculated b values and the values one would have obtained, had a run been excluded; all distances should be of about equal magnitude; if not, then there is reason to believe that the run biased the estimation of the regression coefficients; values greater than 1 are influential; defined as the following:
Standard Error of Estimated Mean: determined by the square root (mean square residual * leverage) for each observation
95% Lower CL: the lower confidence limit for the predicted value (based on the t distribution for alpha = 0.05 and the degrees of freedom of the mean square residual)
95% Upper CL: the upper confidence limit for the predicted value (based on the t distribution for alpha = 0.05 and the degrees of freedom of the mean square residual)