Residuals Plots (ANOVA)
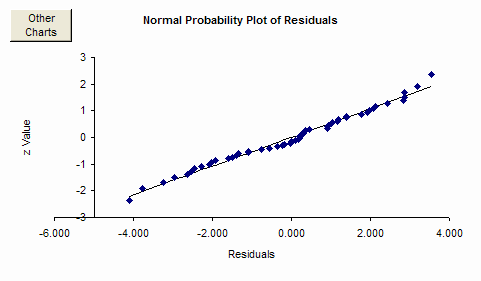
This sheet contains the residuals plot with the initial chart being the normal probability plot of residuals shown below. The residuals should fall along a straight line. This chart is just one of many that can be generated.

The other charts are accessed by selecting the “Other Charts” button in the upper left hand corner. When selected, you will see the input form below. There are two tabs. By default, the tab “Residual Charts” comes up first. With this tab, select the chart you want under the heading “Select Chart” and then select the residual to use under the heading “Select Residual Type to Use.” The four charts can be done with the raw residuals, the standardized residuals, the internally studentized residuals, or the externally studentized residuals.
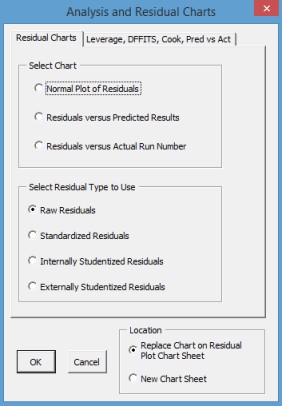
When you select OK, the new chart will be generated. In the lower left hand corner, you have the option to replace the current chart on the residual plot chart sheet or to generate the chart on a new chart sheet.
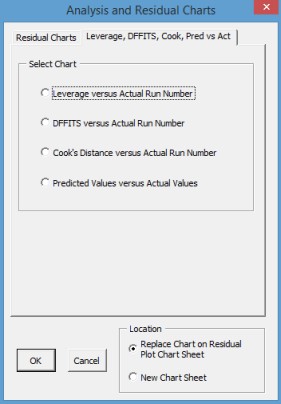
The second tab contains the charts for leverage, DFFITS, and Cook’s distance versus observation number as well as the predicted values versus the actual values. The first three charts contain red lines. Points past the red lines represent potential outliers.