Control Chart Rollup Help
Home » SPC for Excel Help » Analysis Help » ANOVA Help » ANOVA Output Help » Control Chart Rollup Help
An example will be used to describe how the control chart rollup output option works. This option is usually used for nested designs.
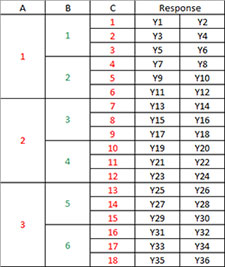
Suppose you have a fully nested design with three factors. The layout of the design is shown below. Factor A has three levels, Factor B has two nested levels, Factor C has three nested levels and there were two replications.

First Rollup
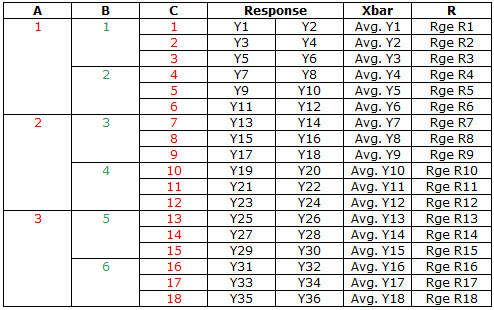
The first control chart rollup is based on the two replications of a treatment. The subgroup averages and ranges are calculated as shown below. Avg. Y1 is the average of Y1 and Y2, while R1 is the absolute difference between Y1 and Y2. The first rollup is a control based on Xbar and R.

Second Rollup
The second control chart rollup takes the Xbar values from the first rollup and uses them to calculate new averages and ranges. Factor C is eliminated from the data. The first subgroup is based on A = 1 and B = 1. There are three averages from above in that subgroup (Y1, Y2 and Y3). These values are used to calculate new Xbar and R values. These new values are used to make the second rollup chart.

Third Rollup
The third rollup uses the averages from the second rollup above. These averages are used to calculate new Xbar and R values for the third rollup chart.

Fourth Rollup
The fourth rollup uses the averages from the third rollup. In this example, this is the last rollup. For the last rollup, an individuals control chart is used with a moving range of two.

