Deming Regression Help
Home » SPC for Excel Help » Analysis Help » Measurement Systems Analysis Help » Deming Regression Help
Deming Regression is a regression method where you take into account the measurement error for both the predictor variable (X) and the response variable (Y). In ordinary regression, the predictor variable is assumed not to have any error. To use Deming Regression, you need to have a measure of the error for both X and Y.
The example below shows how to use Deming Regression in SPC for Excel. This page contains the following:
Data Entry
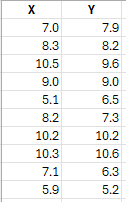
Enter the data into a spreadsheet as shown below. The data can be downloaded here. The data must be in columns with the variable names in the first cell of the column.
Running the Deming Regression
- 1. Select the data and the headings. You can use “Select Cells” in the “Utilities” panel of the SPC for Excel ribbon to quickly select the cells.
- 2. Select “MSA” from the “Analysis” panel on the SPC for Excel ribbon.
- 3. Select "Deming Regression"
- 4. The Deming regression input screen is shown below. The ranges you selected above are the default values.
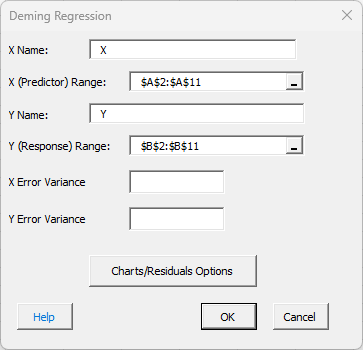
- X Name: name of X variable, default is first cell in X data if non-numeric.
- X (Predictor) Range: range containing X data; default is based on selection on worksheet.
- Y Name: name of Y variable, default is first cell in Y data if non-numeric.
- Y (Response) Range: range containing Y data; default is based on selection on worksheet.
- X Error Variance: error variance for X (0.032 for this example).
- Y Error Variance: error variance for Y (0.008 for this example).
- Charts/Residuals Option: selecting this gives the input form below.
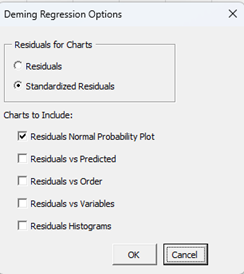
- Select either residuals or standardize residuals for the charts.
- Select which charts to include; default is the residuals normal probability plot.
- Select OK or Cancel to return to the first input form.
- Select OK to run the regression or Cancel to end.
Deming Regression Output
A new worksheet containing the output it added to the workbook. The first part of the output shows the following:
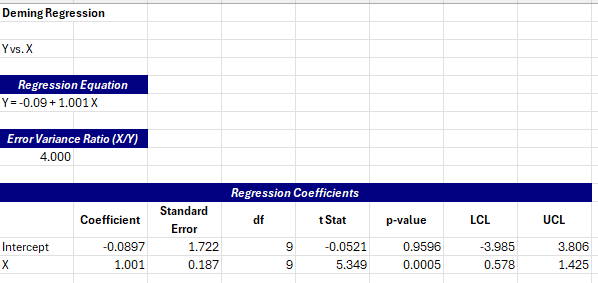
The regression equation is given followed by the error variance ratio (X/Y). The regression coefficients table is given. The columns include the coefficient, the standard error, the degrees of freedom (df), the t-statistic, the p-value for getting that t-statistic and the 95% upper and lower confidence limits (UCL and LCL).
The descriptive statistics table is shown next for X and Y. It includes the number of points, the mean, the standard deviation of the error, the error variance (input above), and the Error coefficient of variance.

The hypothesis testing table is shown next. There are two tests: the slope tests and the mean tests. The null hypothesis for the slope test is based on b1 = 1. The means test is based on b0. The columns in the table are the same as in the regression coefficients table.

The next part of the output is the residuals information.
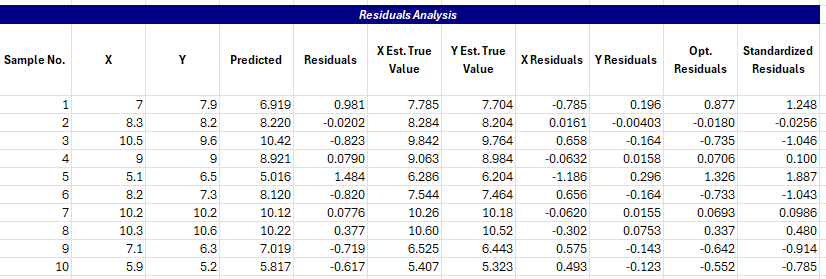
The Predicted column is the predicted value of y. Residuals is the raw residuals. The true values of X and Y are given along with the residuals. These are followed by the optimized residuals and the standardized residuals.
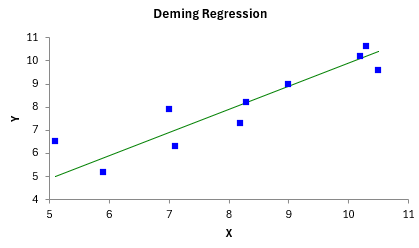
One chart that is always generated is the X vs Y plot. This is shown below. You want the points to fall along the straight line X=Y.
Other charts are the residuals charts selected in the options form above. The residuals normal probability plot is shown below. You want these points to fall along the straight line.

