Bland-Altman Analysis Help
Home » SPC for Excel Help » Analysis Help » Measurement Systems Analysis Help » Bland-Altman Analysis Help
The Bland Altman analysis is used to compare two measurement systems. For example, you might be testing a new measurement system and want to compare that old measurement systems to it.
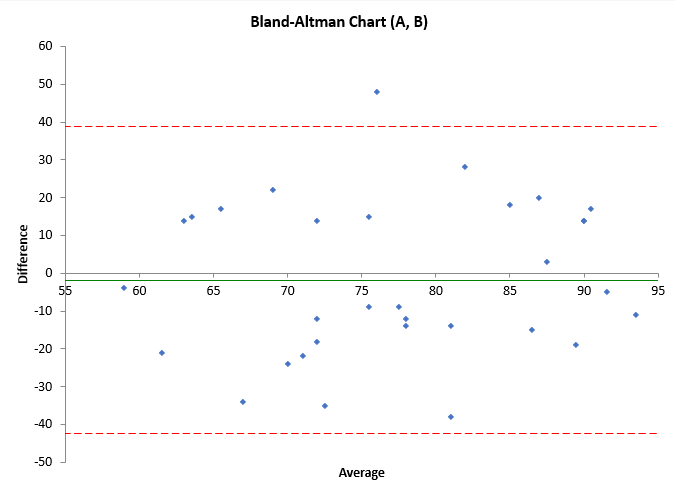
The analysis generates the Bland Altman plot which plots the average measurement on the two methods on the x-axis and the difference between the two measurements on the y-axis. The plot also shows the bias (average difference) and the 95% confidence limits for the bias. This allows you to determine the range of agreement between the two measurement systems.
The example below demonstrates how to perform this test using the SPC for Excel software. You can download the data used at this link.
A chemist is comparing two methods that test a certain property. He wants to know if the methods are the same. He splits 32 samples in two and measures the samples in each instrument.
- Enter the data into an Excel spreadsheet. The data must be in columns, one for each instrument.

2. Select the data including the headings.
3. Select “MSA” from the “Analysis” panel in the SPC for Excel ribbon.
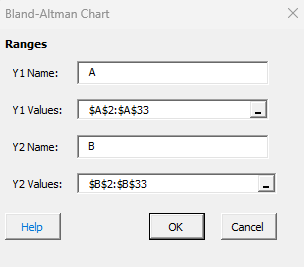
4. Select “Bland Altman”. The input form below is shown.

- Y1 Name: Name of instrument 1, default is first cell in range selected if it is non-numeric.
- Y1 Values: the range of the data for instrument 1; default is determined by the range selected on the worksheet.
- Y2 Name: Name of instrument , default is first cell in range selected if it is non-numeric.
- Y2 Values: the range of the data for instrument 2; default is determined by the range selected on the worksheet.
- Select OK to generate the results.
- Select Cancel to end the program.
Bland-Altman Analysis Output
The Bland Altman plot is shown below.

The green line is the average difference, the bias between the two. The red dotted lines are the 95% confidence limit on the difference.
