Comparing Treatment Means (ANOVA) Help
Home » SPC for Excel Help » Analysis Help » ANOVA Help » ANOVA Output Help » ANOVA: Comparing Means and Variances Help » Comparing Treatment Means (ANOVA) Help
Treatment means are compared using one of three methods:

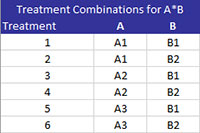
The output below is for the example being used in this section with all factors being fixed and for comparing A*B. When comparing components with more than one factor, the program first generates a table of treatment combinations as shown below. Treatment 1 is A at level A1 and B at level B1. Treatment 2 is A at level A1 and B at level B2. The comparisons are then based on these treatments. There is also the option to chart the pairwise comparisons.
Fisher’s Least Significant Difference Method
The Fisher Least Significant Difference Method is used to compare treatment means. The method compares all pairs of means. It controls the error rate (?) for each individual pairwise comparison but does not control the family error rate. Both error rates are given in the output as shown below.
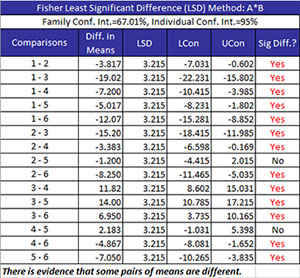
- Comparisons: treatment combinations are being compared
- Diff in Means: the difference in the two treatment means
- LSD: Fisher’s Least Significant Difference which is given by (where N = number of total results, a = number of treatment levels, MSE is the mean square error and n is the sample size for the individual treatment levels):
- LCon: the 100(1-?)% lower confidence interval = difference in means – LSD
- UCon: the 100(1-?)% upper confidence interval = difference in means + LSD
- Sig Diff?: conclusion if there is a significant difference between the two means; if there is a significant difference, Yes is printed and turned to red; otherwise, No is printed. There is a significant difference if the absolute value of the difference in means is greater than the LSD.
Bonferroni’s Method
Bonferroni’s Method is used to compare treatment means. It controls the family error rate (?). Both the family error and the individual error rates are given in the output as shown below.
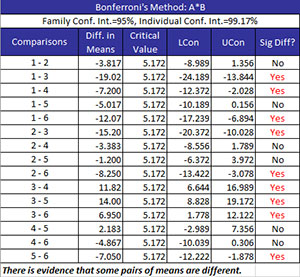
- Comparisons: treatment combinations are being compared
- Diff in Means: the difference in the two treatment means
- Critical Value (where t is the t value for degrees of freedom and a confidence coefficient of ?/k where k is the number of comparisons, MSE = the mean square error, and n = the sample size for the individual treatment levels):
- LCon: the 100(1-?)% lower confidence interval = difference in means – CV
- UCon: the 100(1-?)% upper confidence interval = difference in means + CV
- Sig Diff?: conclusion if there is a significant difference between the two means; if there is a significant difference, Yes is printed and turned to red; otherwise, No is printed. There is a significant difference if the absolute value of the difference in means is greater than the critical value.
Tukey’s Method
Tukey’s Method is used to compare means from multiple processes. The method compares all pairs of means. It controls the family error rate (?). Both the family error and the individual error rates are given in the output as shown below.
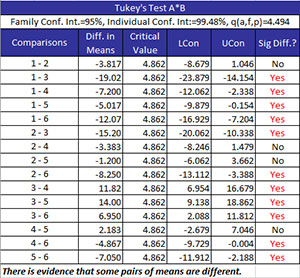
- Comparisons: treatment combinations are being compared
- Diff in Means: the difference in the two treatment means
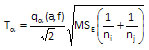
- Critical Value (where q?(a, f) = the studentized range statistic, f = degrees of freedom associated with MSE, a = number of treatment levels, MSE = the mean square error, and n = the sample size for the individual treatment levels):
- LCon: the 100(1-?)% lower confidence interval = difference in means – T?
- UCon: the 100(1-?)% upper confidence interval = difference in means + T?
- Sig Diff?: conclusion if there is a significant difference between the two means; if there is a significant difference, Yes is printed and turned to red; otherwise, No is printed. There is a significant difference if the absolute value of the difference in means is greater than the critical value.
Pairwise Charts
The program will chart the confidence interval for each pairwise combination. An example of the A*B combinations using Fisher’s LSD method is shown below.
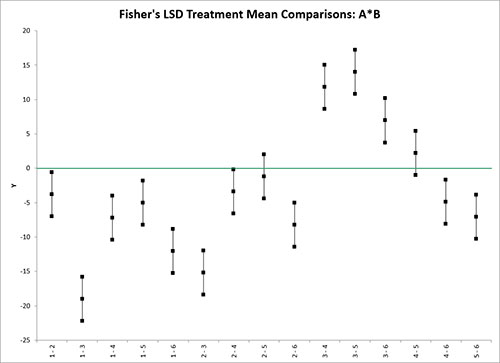
A zero line is included. Any confidence intervals that do not cross the zero line are considered to have significant differences in the treatment means.