c and u Control Chart Complete Teaching Guide
$79.00
Out of stock
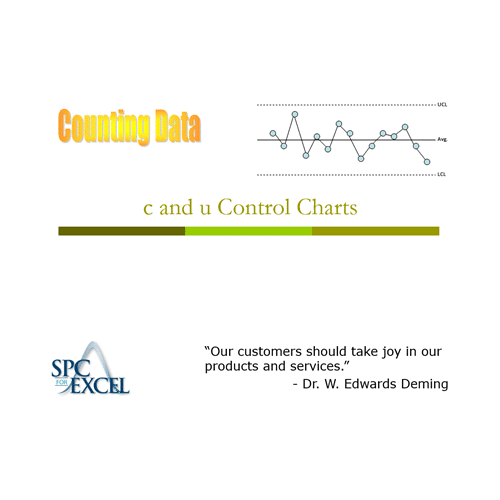
The purpose of this module is to introduce c and u control charts – what they are, when they can be used, how to construct them and how to interpret both charts. In addition, the small sample case for c and u control charts is introduced. The c and u control charts tell you if the process is in statistical control or if there are special causes present.
Exercises and examples include OSHA recordable injuries, emergency work orders in maintenance, customer complaints, hospital infections, assembly defects and plastic imperfections. The control limit equations commonly used for the c and u control charts are only valid under certain conditions. This module covers the “small sample case” and shows what to do when the control limit equations are not valid. Exercises include questions about what the charts are telling you about the process.
The module includes the following:
- Handout (25 pages)
- Teaching Guide (2 pages)
- Solutions to Exercises (10 pages)
- PowerPoint Presentation (41 slides)
- Excel Workbook Containing the Data
- Excel Workbook Containing the Solutions
