September 2025
 Ever wonder how control limits are calculated? Or how sigma is estimated from an average range? Or is it true that individuals control charts can be used anywhere? Or for that matter, where are control charts used? Or how do you compare the means of two processes? Or if your measurement system is “good” enough.
This month’s publication is a bit different. We have been publishing monthly articles since January 2004 on a statistical process control ( SPC) or statistical analysis topic. The first topic over 20 years ago was on variation – where you should always start when talking about process improvement. This is our 261st article. Pretty amazing. And yes, we did miss two month over these 21 plus years. But we had two months where we published two so it evens out.
These articles represent a wealth of knowledge – all free. It is our gift to help people navigate through the world of SPC and statistical analysis. The articles are written in (hopefully) an easy to read style with a focus on understanding what the technique covered in the article tells you about your process.
We refer to these publications collectively as the SPC Knowledge Base. Here is what one customer has to say about the SPC Knowledge Base:
I can’t begin to tell you how helpful the articles in your knowledge base have been to me and my company. I’ve taken a lot of statistics, in college, grad school, Lean Six Sigma Black Belt certification courses, corporate training, etc., and the explanations you have provided are by far the best SPC resources I’ve encountered. I particularly appreciate your use of actual examples with numbers that I can copy down in an Excel spreadsheet and review to enhance my own understanding of the material. You have provided an excellent service to the SPC community!”
-Newton B. Green II, PE, PMP, DEE
The SPC Knowledge Base isn’t just a collection of articles — it’s a bridge between theory and practice. It covers both basic and advanced topics, meeting you wherever you are in your SPC journey.
So, instead of focusing on one topic in this publication, we are going to let you know what is available in our 260+ articles – our SPC Knowledge Base – and how to navigate through all this free knowledge to find what you want.
We hope you find the publications useful and enjoy them. In this publication:
- The SPC Knowledge Base on the Website
- The Major Categories of the SPC Knowledge Base
- Navigating the SPC Knowledge Base
- Summary
- Quick Links
Please feel free to leave a comment at the end of this publication. You can download a pdf copy at this link.
The SPC Knowledge Base on the Website
The SPC Knowledge Base is on the www.spcforexcel.com website. It is important to note that the publications are not about the SPC for Excel software. Yes, the software is used to analyze the data in the publications, but the emphasis is on explaining the technique and the reasoning and math behind the technique.
There are two ways to access the SPC Knowledge Base:
- One is by the month and year the publication was published (SPC Knowledge Base – SPC for Excel)
- The other has the publications sorted by category (SPC for Excel Publications by Category – SPC for Excel)
The easiest way to navigate the SPC Knowledge Base is by the categories. These are described below.
The Major Categories of the SPC Knowledge Base
As the number of publications in the SPC Knowledge Base increased, it was becoming harder to navigate through all of them. To help alleviate that issue, the publications were classified according to categories. Figure 1 is a diagram that shows the number of publications by category in the SPC Knowledge Base. There are 17 categories.
Figure 1: SPC Knowledge Base Publications by Category
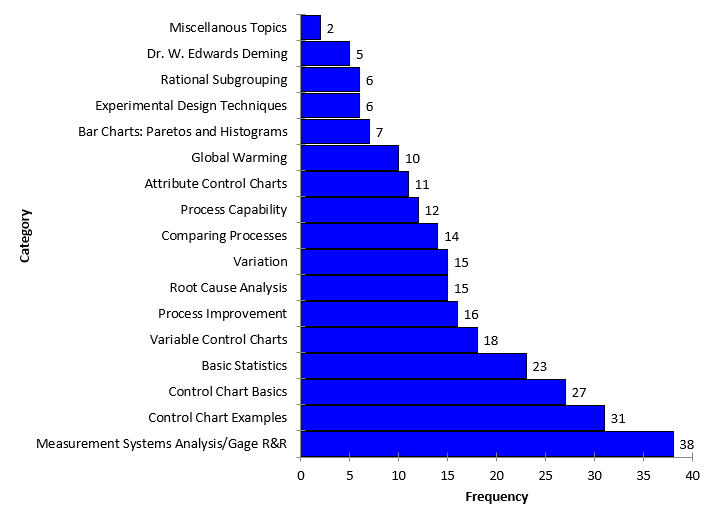
The largest number of publications in a category is the number of measurement systems analysis/Gage R&R. There are 38 publications in the category. There are 31 publications on control chart examples.
Navigating the SPC Knowledge Base
The best way to navigate the SPC Knowledge Base is by using the categories. Go to the link for the categories (SPC for Excel Publications by Category – SPC for Excel) and then scroll down to the category you want. The table below provides the category, an explanation of the purpose or focus of the category, and the titles of a few example publications for that category.
Table 1: Categories of the SPC Knowledge Base
|
Category |
Purpose / Focus |
Example Publications |
|
Variation |
Starts with understanding variation; introduce and explore the concept of variation in processes (common causes and special causes), and how to think about variation in practice. |
· Variation (January 2004) · Leadership and Variation (February 2004) · Control Limits and Specifications: The Four Process States (February 2022) · A Look Back at Variation (December 2016) · Variation and In-Control Processes (April 2025) |
|
Dr. W. Edwards Deming |
Articles about Dr. Deming’s philosophies, his “profound knowledge,” and how his thinking applies to SPC and continuous improvement. |
· Dr. W. Edwards Deming and Profound Knowledge – Part 1 (October 2006) · Remembering Dr. W. Edwards Deming (December 2018) |
|
Control Chart Basics |
Provides the foundation for understanding control charts: what they are, rules and interpretation, when and how to use them. |
· Interpreting Control Charts (April 2004) SPC for Excel · Control Chart Rules and Interpretation (March 2016) · Selecting the Right Control Chart (April 2006) |
|
Variable Control Charts |
Control charts for continuous (measurement) data — -R, X-mR, -s , -mR-R, EWMA, CUSUM, z, T2, etc., comparison of charts, chunky and rare event data |
· -R Charts: Part 1 (March 2005) · Individuals Control Charts (October 2006) · Comparing X̄-R and X̄-s Control Charts (April 2021) · Multivariate Control Charts (Hotelling T²) (October 2019) |
|
Rational Subgrouping |
Shows how to consider rational subgrouping in designing a control chart; want to monitor the variation you are interested in. |
· Rational Subgrouping and Xbar-R Charts (May 2005) · Remember Rational Subgrouping? (September 2023) · Rational Sampling and the Individuals Control Chart (March 2025) |
|
Attribute Control Charts |
For count or defect-type data (p, np, c, u, g). |
· c Control Charts (July 2004) · p Control Charts (July 2005) · Laney p′ Control Chart (May 2019) · The g Chart vs the Individuals Chart (October 2021) |
|
Control Chart Examples |
Real-world or illustrative applications of control charts — across industries, special topics; answers the question where can control charts be used. |
· Monitoring Customer Complaints Using SPC (June 2006) · SPC & Process Improvement in the Warehouse (August 2007 · SPC and Tornadoes (April 2023) · Control Charts and Crime (August 2025) |
|
Bar Charts: Pareto and Histogram |
To discuss the use of Pareto charts and histograms (bar charts) for exploring and summarizing data / prioritizing issues |
· Pareto Charts (June 2004) · Histograms – Part 1 (December 2005) · Variable and Two-Level Pareto Diagrams (January 2020) · The Impact of Bar Width on Histograms (October 2022) |
|
Global Warming |
To examine global temperatures from 1880 to Present |
· Global Warming: A Trend or Step Changes? (June 2020) · SPC and Global Warming: 1880 – 2024 (January 2025) |
|
Measurement Systems Analysis / Gage R&R |
To analyze and understand measurement systems (bias, stability, linearity, repeatability, reproducibility), and how measurement error interacts with process control; a focus on Dr. Donald Wheeler’s EMP. |
· Operational Definitions / Measurement System Analysis (March 2004) · ANOVA Gage R&R – Part 1 (August 2012) · Evaluating the Measurement Process – Part 1 (December 2014) · Monitoring Test Methods Using SPC (May 2006) |
|
Process Capability |
To study how well a process can meet specifications (Cp, Cpk, Pp, Ppk, etc.), including handling non-normal data and capability diagnostics |
· Process Capability Part 1 (October 2004) · Cpk Improvement Methodology (February 2012) · Process Capability and Non-Normal Data (July 2014) · Binomial Process Capability (July 2020) |
|
Root Cause Analysis |
Techniques for diagnosing causes of defects, using regression, ANOVA, fishbone diagrams, scatter plots, etc. |
· Scatter Diagrams (February 2005) · Creating Cause and Effect Diagrams (October 2005) · Single Factor ANOVA (December 2008) · Stepwise Regression (September 2015) |
|
Comparing Processes |
Statistical methods to compare groups, treatments, proportions — e.g. t-tests, ANOM, ANOVA, nonparametric tests, Box-Whisker, equivalence testing. |
· Comparing Two Processes (August 2006) · Comparing Multiple Processes (February 2007) · The Analysis of Means and Ranges (January 2019) · Comparing Two Proportions (May 2024) |
|
Experimental Design Techniques |
Design of experiments (DOE), factorial designs, fractional factorials, and design-based exploration of variation. |
· Experimental Design Techniques – Part 1 (January 2010) · Fractional Factorial Designs – Part 1 (September 2018) · Design of Experiments in Pharmaceutical Development (April 2010) |
|
Basic Statistics |
Cover fundamental statistical concepts: distribution fitting, hypothesis testing, transformations, nonparametric methods, descriptive stats, normality tests. |
· Explaining Standard Deviation (August 2005) · Normal Distribution (May 2009) · Anderson-Darling Test for Normality (June 2011) · Box-Cox Transformation (July 2016) · Grubbs’ Test for Outlier (October 2024) |
|
Process Improvement |
Broader improvement methods, blending people, process, lean, kaizen, theory of constraints, problem-solving models, 7 quality tools, etc. |
· Problem-Solving Model (May 2004) · Kaizen and SPC (March 2013) · Process Flow Diagrams (October 2017) · Dr. Ishikawa’s Seven Quality Tools (August 2017) · What Do I Work on First: Process or Measurement? (June 2022) |
|
Miscellaneous |
Topics that don’t fit neatly in the other categories. |
· SPC and Jeopardy (December 2012) · Top Ten SPC Questions (December 2013) SPC for Excel |
Summary
This publication has introduced the categories in the SPC Knowledge Base to help you navigate through the 260+ articles on the website. The SPC Knowledge Base began back in January 2004 with our first publication on variation – the place for process improvement to start. We hope you have found this publication and our SPC Knowledge Base useful.